

Question: Figure 2 below plots monthly price data for corn in a US state from 2000M1 to 2009M12. a) Examine the patterns of this time series.
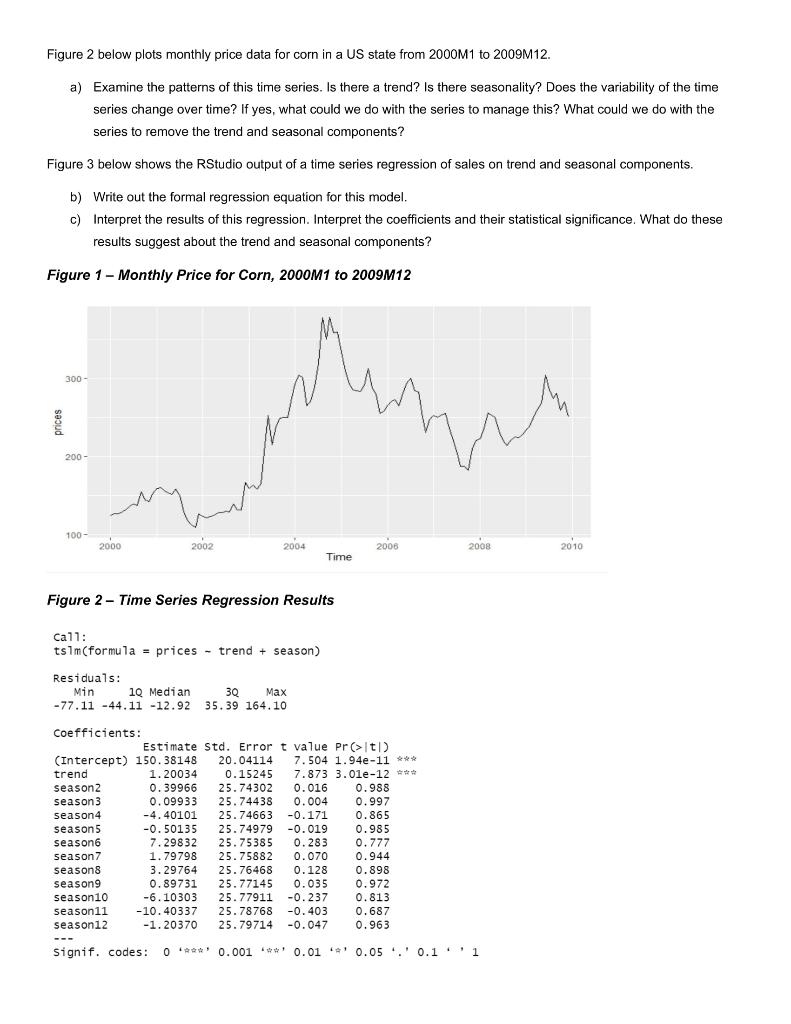
Figure 2 below plots monthly price data for corn in a US state from 2000M1 to 2009M12. a) Examine the patterns of this time series. Is there a trend? Is there seasonality? Does the variability of the time series change over time? If yes, what could we do with the series to manage this? What could we do with the series to remove the trend and seasonal components? Figure 3 below shows the RStudio output of a time series regression of sales on trend and seasonal components. b) Write out the formal regression equation for this model. c) Interpret the results of this regression. Interpret the coefficients and their statistical significance. What do these results suggest about the trend and seasonal components? Figure 1 - Monthly Price for Corn, 2000M1 to 2009M12 Figure 2 below plots monthly price data for corn in a US state from 2000M1 to 2009M12. a) Examine the patterns of this time series. Is there a trend? Is there seasonality? Does the variability of the time series change over time? If yes, what could we do with the series to manage this? What could we do with the series to remove the trend and seasonal components? Figure 3 below shows the RStudio output of a time series regression of sales on trend and seasonal components. b) Write out the formal regression equation for this model. c) Interpret the results of this regression. Interpret the coefficients and their statistical significance. What do these results suggest about the trend and seasonal components? Figure 1 - Monthly Price for Corn, 2000M1 to 2009M12
Step by Step Solution
There are 3 Steps involved in it

Get step-by-step solutions from verified subject matter experts