

Question: Figure 2 : Experimental Setup. The hex on the left is the motion sensor. We are also able to dene our coordinates such that the
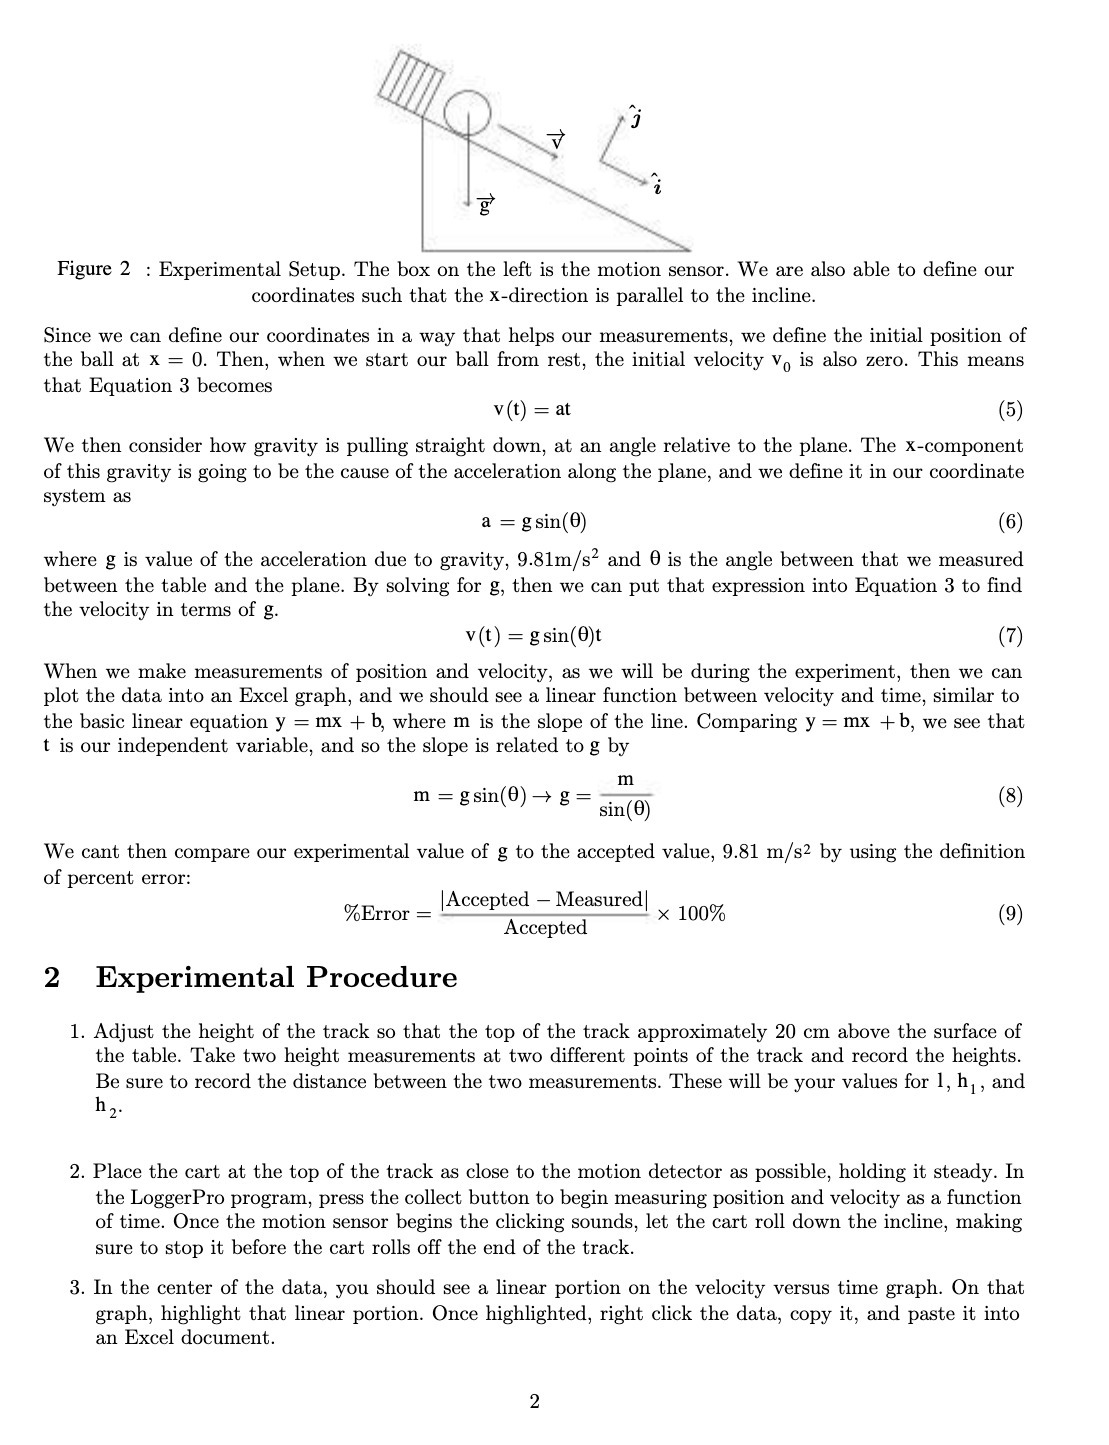
Figure 2 : Experimental Setup. The hex on the left is the motion sensor. We are also able to dene our coordinates such that the xdirection is parallel to the incline. Since we can dene our coordinates in a way that helps our measurements, we dene the initial position of the ball at x = 0. Then, when we start our ball from rest, the initial velocity V0 is also zero. This means that Equation 3 beconles v(t) 2 at (5) 'We then consider how gravity is pulling straight down, at an angle relative to the plane. The Xcomponent of this gravity is going to be the cause of the acceleration along the plane, and we define it in our coordinate system as a = gsin(B) {6) where g is value of the acceleration due to gravity, 9.81n1/ 52 and B is the angle between that we measured between the table and the plane. By solving for g, then we can put that expression into Equation 3 to find the velocity in terms of g. v(t) = gsin(8)t [7) 'Nhen we make measurements of position and velocity, as we will be during the experiment, then we can plot the data into an Excel graph, and we should see a linear function between velocity and time, similar to the basic linear equation y = mx + b, where m is the slope of the line. Comparing y = mx + b, we see that t is our independent variable, and so the slope is related to g by m In 2 sin 3 > = 8 'We cant then compare our experimental value of g to the accepted value, 9.81 In/s2 by using the definition of percent error: |Accepted Measured Accepted %Error 2 X 100% {9) 2 Experimental Procedure 1. Adjust the height of the track so that the top of the track approximately 20 cm above the surface of the table. Take two height measurements at two different points of the track and record the heights. Be sure to record the distance between the two rneaSurernents. These will be your values far l, h,, and h, 2. Place the cart at the top of the track as close to the motion detector as possible, holding it steady. In the Loggerl'ro program, press the collect button to begin measuring positiOn and velocity as a function of time. Once the motion sensor begins the clicking sounds, let the cart roll down the incline, making sure to stop it before the cart rolls off the end of the track. 3. In the center of the data, you should see a linear portion on the velocity versus time graph. On that graph, highlight that linear portion. Once highlighted, right click the data, cepy it, and paste it into an Excel document
Step by Step Solution
There are 3 Steps involved in it

Get step-by-step solutions from verified subject matter experts