

Question: Figure 2 Question 1 Figure 1 Q2) When activity coefficients are included by the Margule's equation, a different equilibrium curve results as shown in Figure
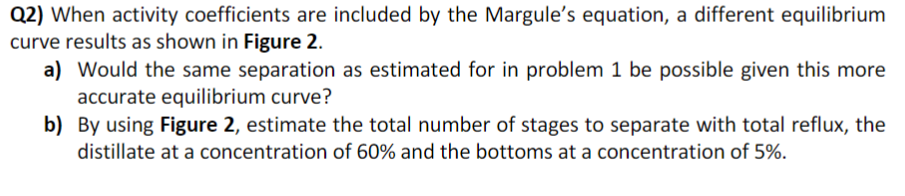
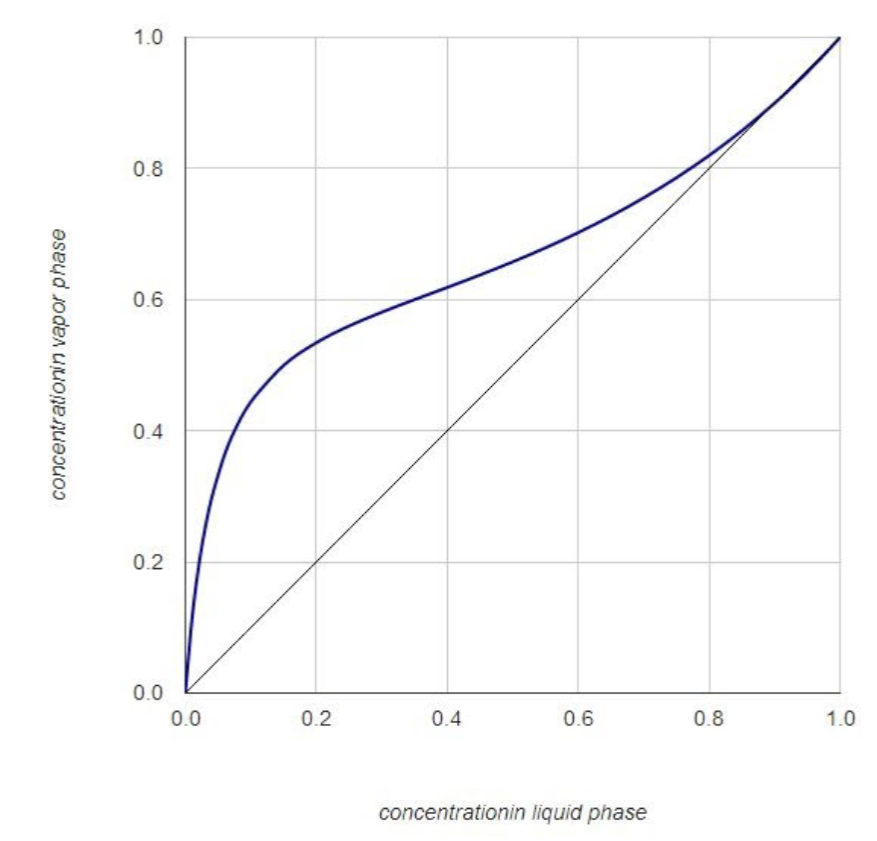
Figure 2
Question 1
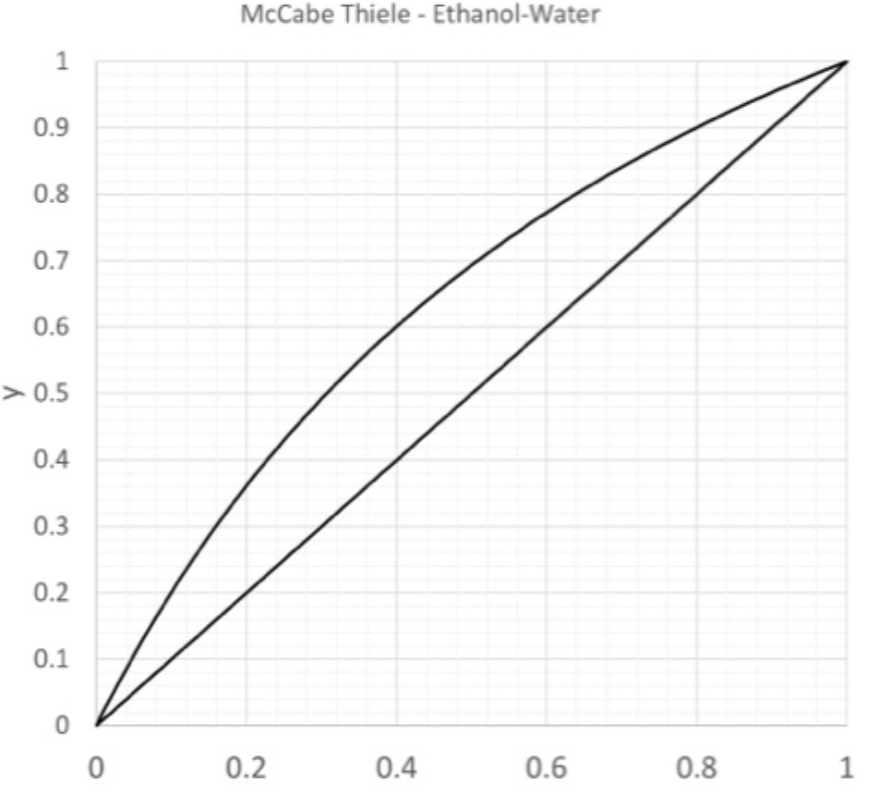
Figure 1
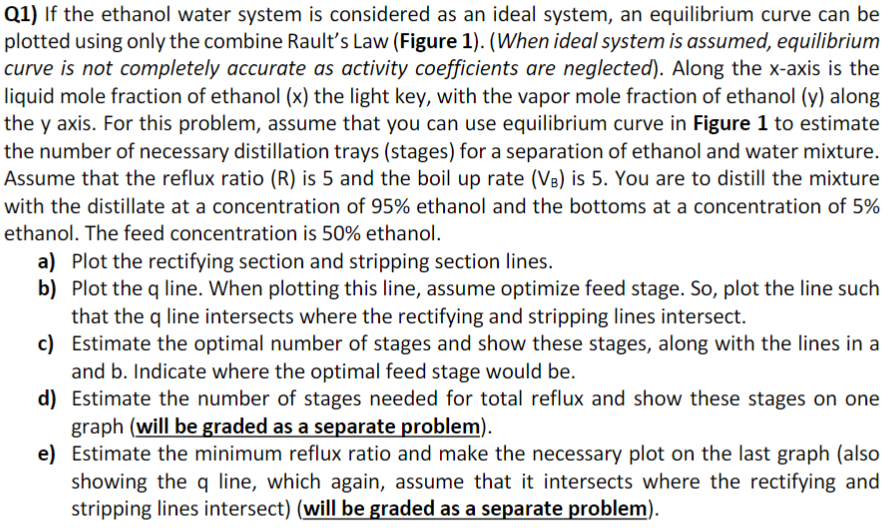
Q2) When activity coefficients are included by the Margule's equation, a different equilibrium curve results as shown in Figure 2. a) Would the same separation as estimated for in problem 1 be possible given this more accurate equilibrium curve? b) By using Figure 2, estimate the total number of stages to separate with total reflux, the distillate at a concentration of 60% and the bottoms at a concentration of 5%. 1.0 0.8 0.6 concentrationin vapor phase 0.4 0.2 0.0 0.0 0.2 0.4 0.6 0.8 1.0 concentrationin liquid phase Q1) If the ethanol water system is considered as an ideal system, an equilibrium curve can be plotted using only the combine Rault's Law (Figure 1). (When ideal system is assumed, equilibrium curve is not completely accurate as activity coefficients are neglected). Along the x-axis is the liquid mole fraction of ethanol (x) the light key, with the vapor mole fraction of ethanol (y) along the y axis. For this problem, assume that you can use equilibrium curve in Figure 1 to estimate the number of necessary distillation trays (stages) for a separation of ethanol and water mixture. Assume that the reflux ratio (R) is 5 and the boil up rate (VB) is 5. You are to distill the mixture with the distillate at a concentration of 95% ethanol and the bottoms at a concentration of 5% ethanol. The feed concentration is 50% ethanol. a) Plot the rectifying section and stripping section lines. b) Plot the q line. When plotting this line, assume optimize feed stage. So, plot the line such that the q line intersects where the rectifying and stripping lines intersect. c) Estimate the optimal number of stages and show these stages, along with the lines in a and b. Indicate where the optimal feed stage would be. d) Estimate the number of stages needed for total reflux and show these stages on one graph (will be graded as a separate problem). e) Estimate the minimum reflux ratio and make the necessary plot on the last graph (also showing the q line, which again, assume that it intersects where the rectifying and stripping lines intersect) (will be graded as a separate problem). McCabe Thiele - Ethanol-Water 1 0.9 0.8 0.7 0.6 > 0.5 0.4 0.3 0.2 0.1 0 0 0.2 0.4 0.6 0.8 1
Step by Step Solution
There are 3 Steps involved in it

Get step-by-step solutions from verified subject matter experts