

Question: Figure 2 shows tier 1 , tier 2 , and tier 3 co - channel cells for N = 3 . We consider the intended
Figure shows tier tier and tier cochannel cells for We consider the intended base
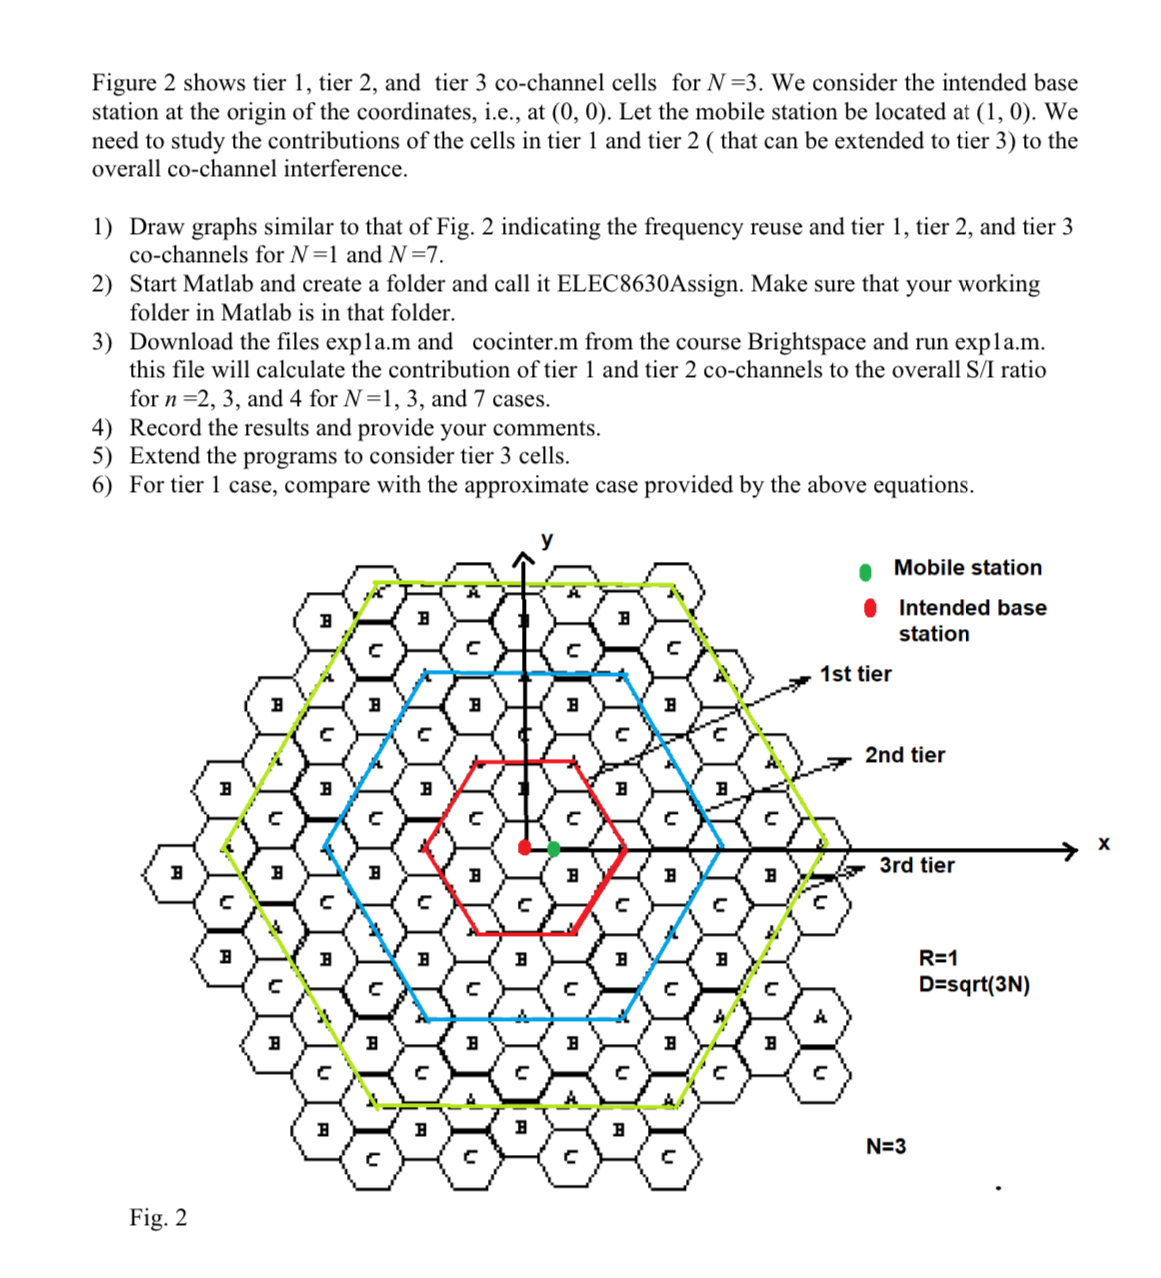
station at the origin of the coordinates, ie at Let the mobile station be located at We
need to study the contributions of the cells in tier and tier that can be extended to tier to the
overall cochannel interference.
Draw graphs similar to that of Fig. indicating the frequency reuse and tier tier and tier
cochannels for and
Start Matlab and create a folder and call it ELECAssign. Make sure that your working
folder in Matlab is in that folder.
Download the files expla.m and cocinter.m from the course Brightspace and run expla.m
this file will calculate the contribution of tier and tier cochannels to the overall SI ratio
for and for and cases.
Record the results and provide your comments.
Extend the programs to consider tier cells.
For tier case, compare with the approximate case provided by the above equations.
Fig.
Step by Step Solution
There are 3 Steps involved in it
1 Expert Approved Answer
Step: 1 Unlock

Question Has Been Solved by an Expert!
Get step-by-step solutions from verified subject matter experts
Step: 2 Unlock
Step: 3 Unlock