

Question: Figure 2-6. Spreadsheet Simulation of the M/U/1 Queue C.5 Exponential( ) EXPONENTIAL(Mean) or EXPO(Mean) or EX(ParamSet) Probability Density Function f(x)={1ex/0forx>0otherwise Parameters The mean () specified

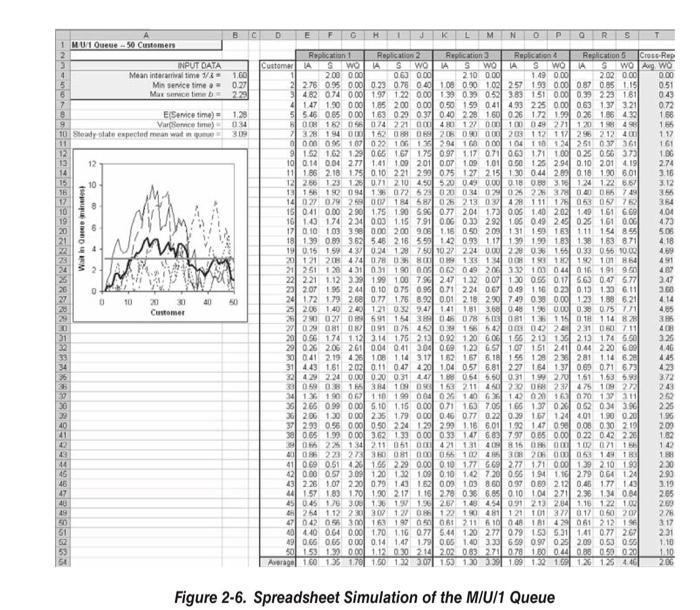

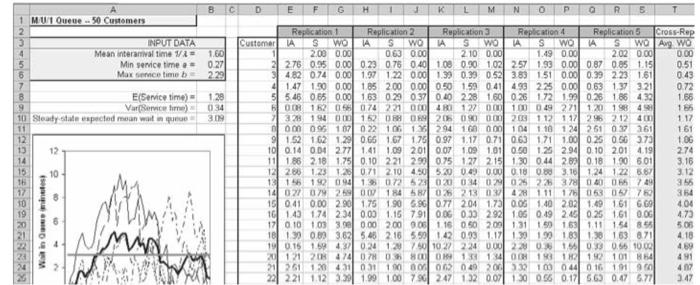
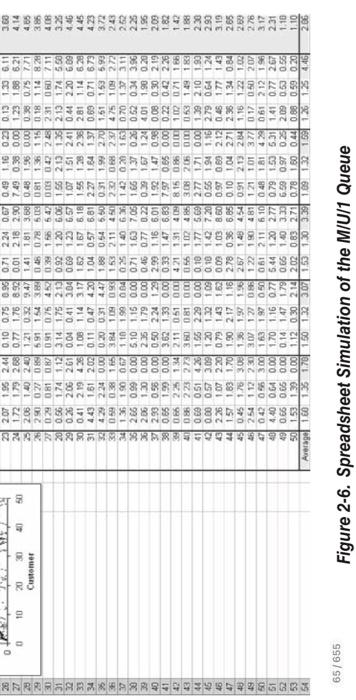
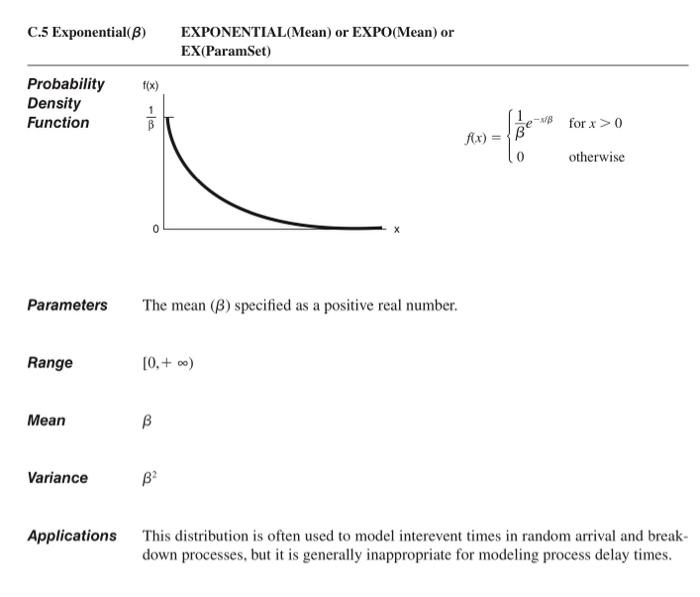
Figure 2-6. Spreadsheet Simulation of the M/U/1 Queue C.5 Exponential( ) EXPONENTIAL(Mean) or EXPO(Mean) or EX(ParamSet) Probability Density Function f(x)={1ex/0forx>0otherwise Parameters The mean () specified as a positive real number. Range [0,+) Mean Variance 2 Applications This distribution is often used to model interevent times in random arrival and breakdown processes, but it is generally inappropriate for modeling process delay times. 2-13 Modify the M/U/1 queue spreadsheet simulation from Section 2.7.2 to have exponential service times with mean 1.28 minutes, rather than the original uniform service times, resulting in the M/M/1 queue. Change the steady-state expected wait in queue appropriately; see the exponential-distribution entry in Appendix C. Figure 2-6. Spreadsheet Simulation of the M/U/1 Queue C.5 Exponential( ) EXPONENTIAL(Mean) or EXPO(Mean) or EX(ParamSet) Probability Density Function f(x)={1ex/0forx>0otherwise Parameters The mean () specified as a positive real number. Range [0,+) Mean Variance 2 Applications This distribution is often used to model interevent times in random arrival and breakdown processes, but it is generally inappropriate for modeling process delay times. 2-13 Modify the M/U/1 queue spreadsheet simulation from Section 2.7.2 to have exponential service times with mean 1.28 minutes, rather than the original uniform service times, resulting in the M/M/1 queue. Change the steady-state expected wait in queue appropriately; see the exponential-distribution entry in Appendix C
Step by Step Solution
There are 3 Steps involved in it

Get step-by-step solutions from verified subject matter experts