

Question: Figure 3: Residual Plot Figure 2: Linear Regression Output Residuals vs. Carat Size Simple linear regression results: Color Category = Colorless and Clarity Category =
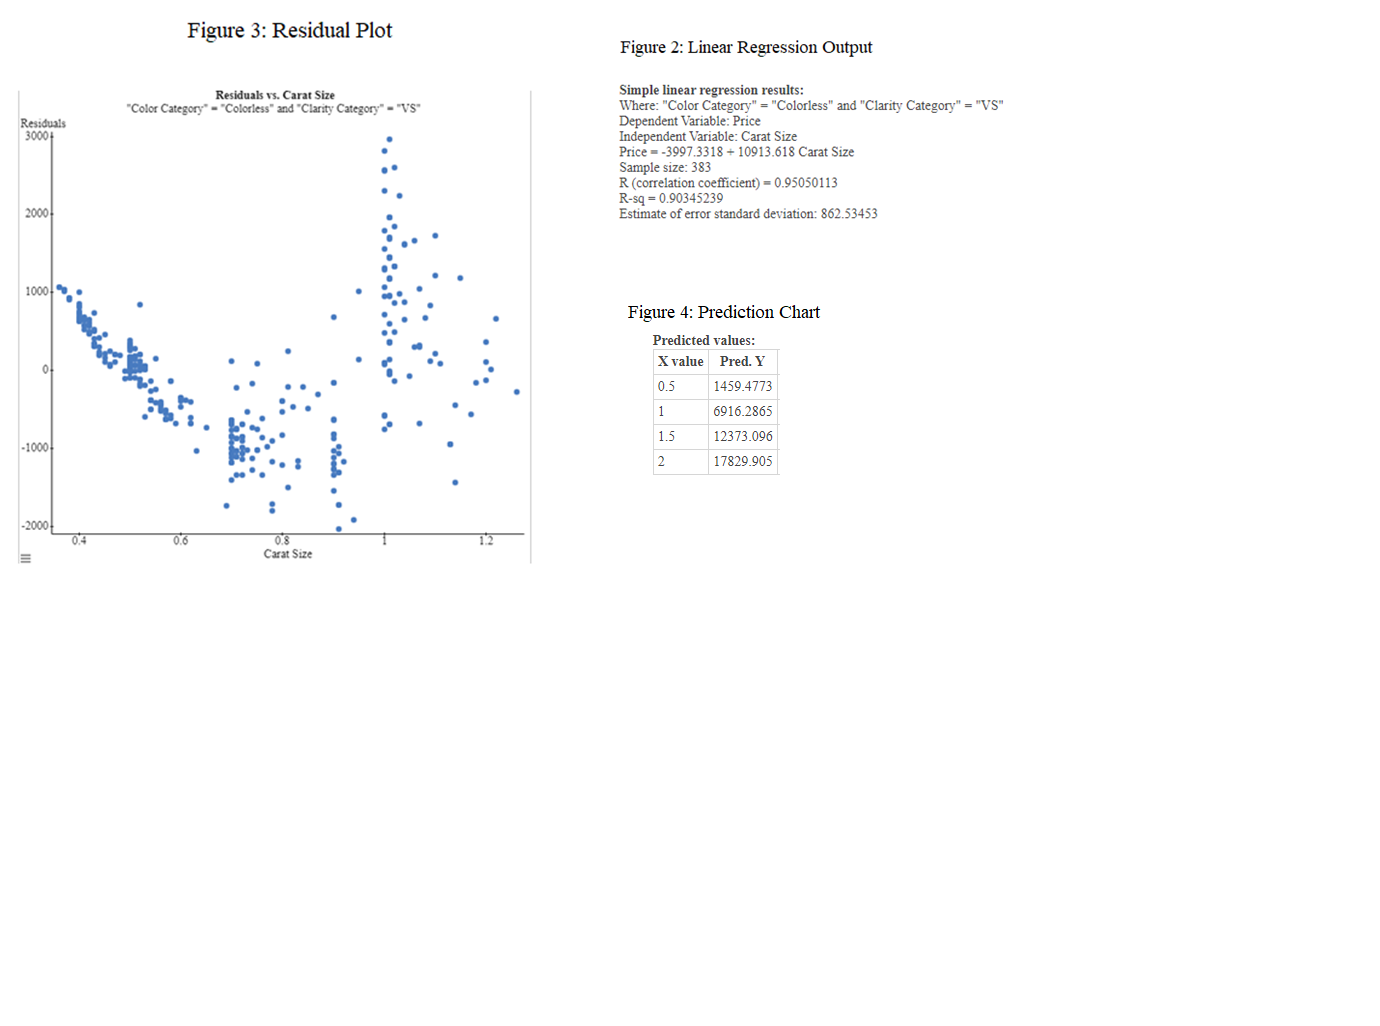
Figure 3: Residual Plot Figure 2: Linear Regression Output Residuals vs. Carat Size Simple linear regression results: "Color Category" = "Colorless" and "Clarity Category" = "VS" Where: "Color Category" = "Colorless" and "Clarity Category" = "VS" Residuals 30004 Dependent Variable: Price Independent Variable: Carat Size Price - -3997.3318 + 10913.618 Carat Size Sample size: 383 R (correlation coefficient) = 0.95050113 R-sq = 0.90345239 2000 Estimate of error standard deviation: 862.53453 1000 Figure 4: Prediction Chart Predicted values: X value Pred. Y 0.5 1459.4773 1 6916.2865 -1000 1.5 12373.096 2 17829.905 -2000 0.6 0.8 1.2 Carat Size
Step by Step Solution
There are 3 Steps involved in it

Get step-by-step solutions from verified subject matter experts