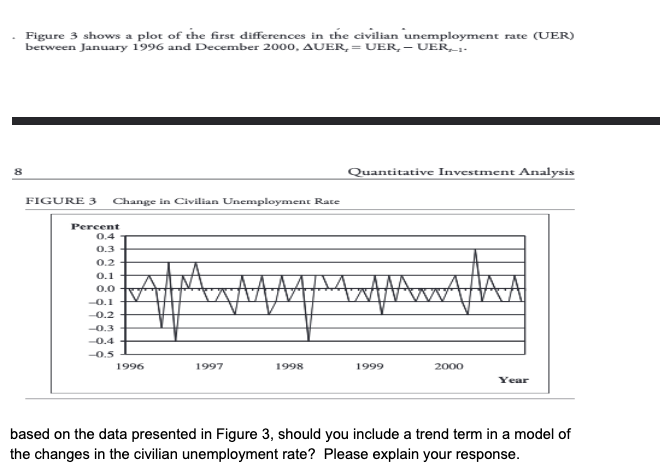
Question: Figure 3 shows a plot of the first differences in the civilian unemployment rate (UER) between January 1996 and December 2000, AUER, = UER, -

Figure 3 shows a plot of the first differences in
Figure 3 shows a plot of the first differences in the civilian unemployment rate (UER) between January 1996 and December 2000, AUER, = UER, - UER,_1. 8 Quantitative Investment Analysis FIGURE 3 Change in Civilian Unemployment Race Percent 0.4 0.3 0.2 0.1 0.0 0.1 MAMAA -0.2 -0.3 -0.4 -0.5 1996 1997 1998 1999 2000 Year based on the data presented in Figure 3, should you include a trend term in a model of the changes in the civilian unemployment rate? Please explain your response

Step by Step Solution

There are 3 Steps involved in it

1 Expert Approved Answer
Step: 1 Unlock blur-text-image
Question Has Been Solved by an Expert!

Get step-by-step solutions from verified subject matter experts

Step: 2 Unlock
Step: 3 Unlock

Students Have Also Explored These Related Finance Questions!