

Question: Figure 3: The figure below depicts average total cost functions for a firm that produces automobiles Average Total Cost (5) ATCO ATCC ATCA ATCY M
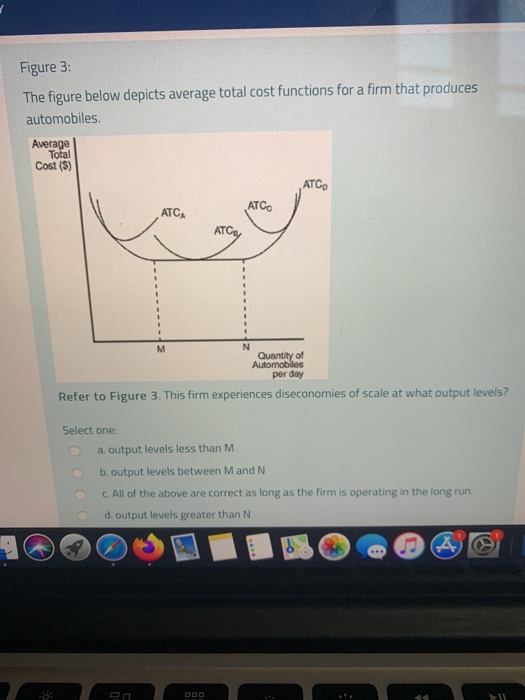
Figure 3: The figure below depicts average total cost functions for a firm that produces automobiles Average Total Cost (5) ATCO ATCC ATCA ATCY M N Quantity of Automobiles per day Refer to Figure 3. This firm experiences diseconomies of scale at what output levels? Select one: a. output levels less than M b. output levels between Mand N c. All of the above are correct as long as the firm is operating in the long run. d. output levels greater than N 10
Step by Step Solution
There are 3 Steps involved in it
1 Expert Approved Answer
Step: 1 Unlock

Question Has Been Solved by an Expert!
Get step-by-step solutions from verified subject matter experts
Step: 2 Unlock
Step: 3 Unlock