

Question: Figure 3-18 Price A B D C E P2 D Q1 Q2 Quantity Refer to Figure 3-18. Which area represents consumer surplus at a price
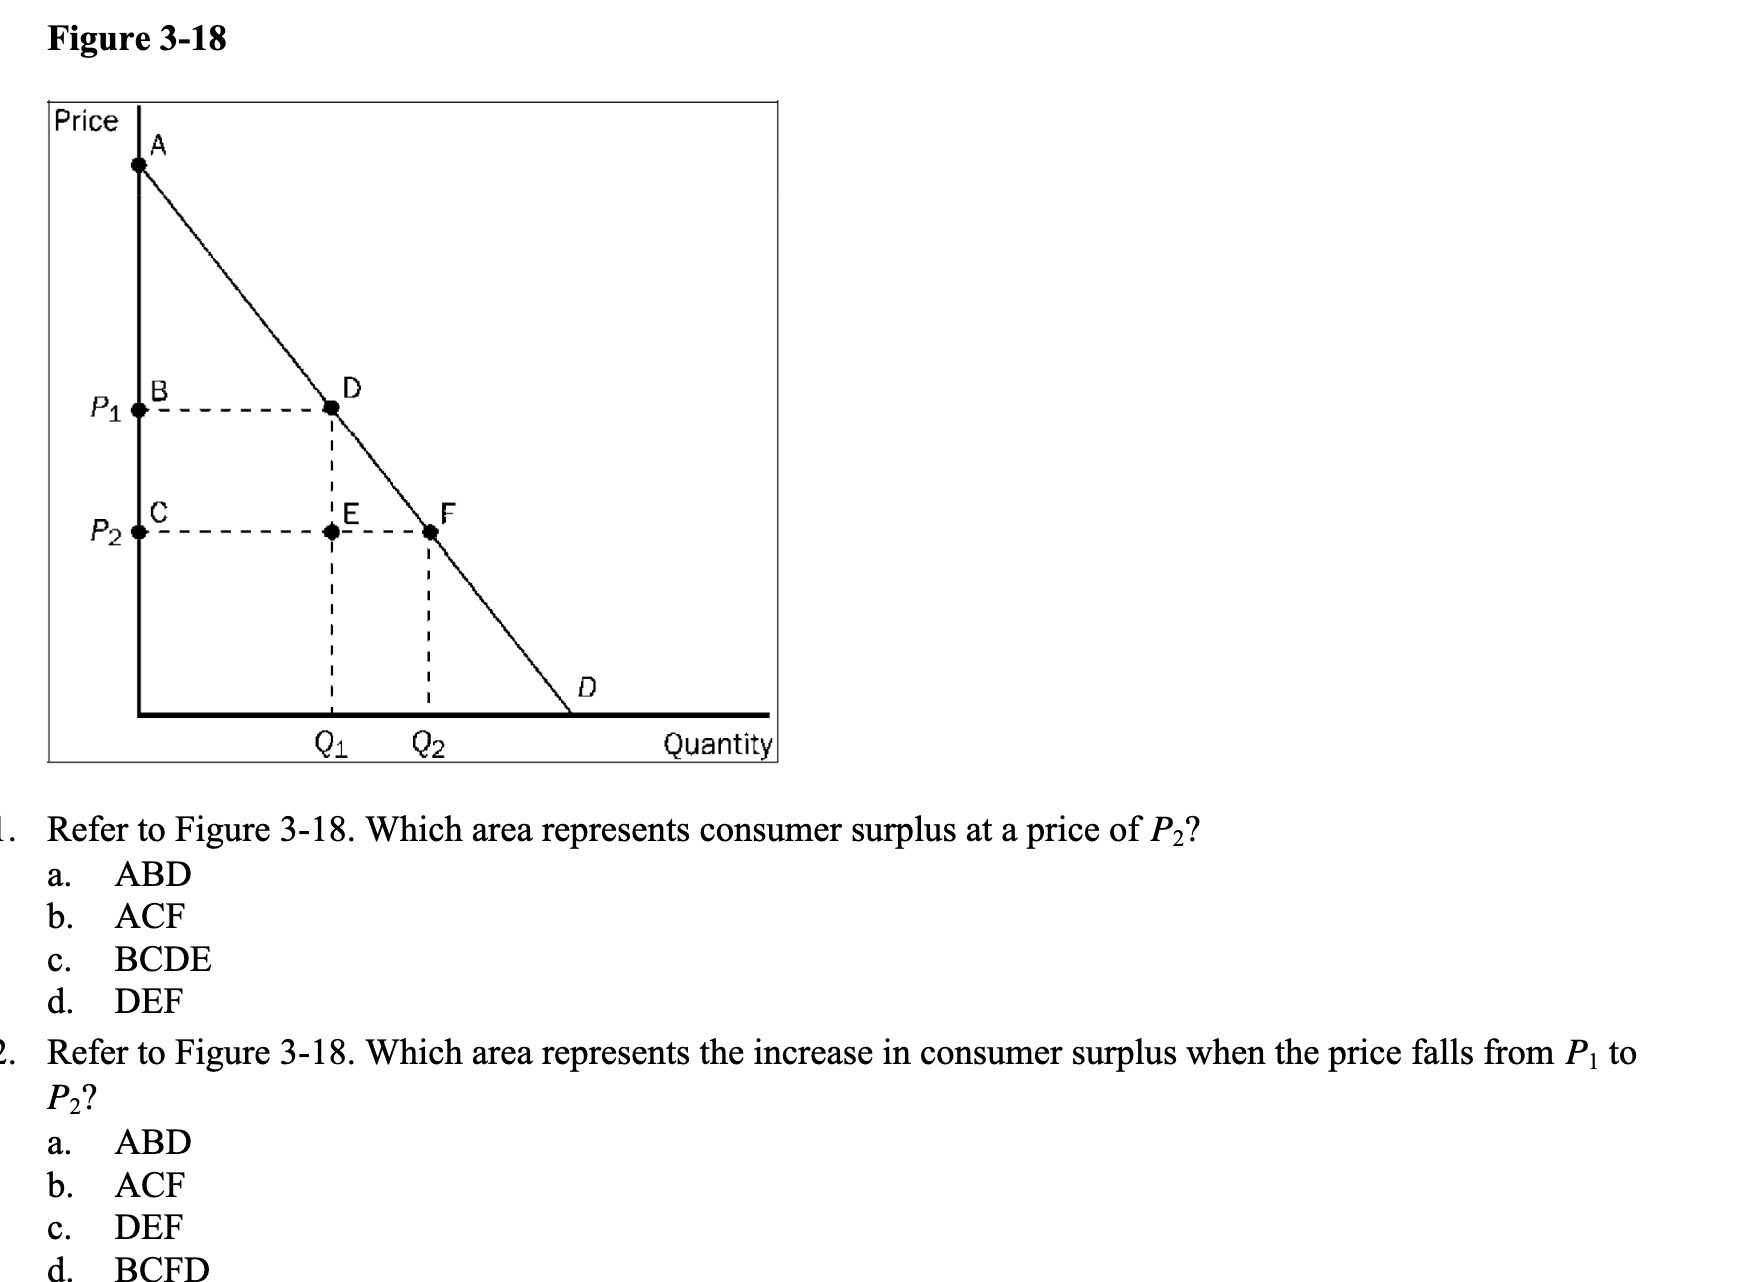

Figure 3-18 Price A B D C E P2 D Q1 Q2 Quantity Refer to Figure 3-18. Which area represents consumer surplus at a price of P2? a. ABD b. ACF C. BCDE d. DEF Refer to Figure 3-18. Which area represents the increase in consumer surplus when the price falls from P1 to P2? a. ABD b. ACF C. DEF d BCED
Step by Step Solution
There are 3 Steps involved in it
1 Expert Approved Answer
Step: 1 Unlock

Question Has Been Solved by an Expert!
Get step-by-step solutions from verified subject matter experts
Step: 2 Unlock
Step: 3 Unlock