

Question: Figure 38 Price level b B C LRAS C D C E SRASO B Real GDP AD 38 The economy s short run SRAS and
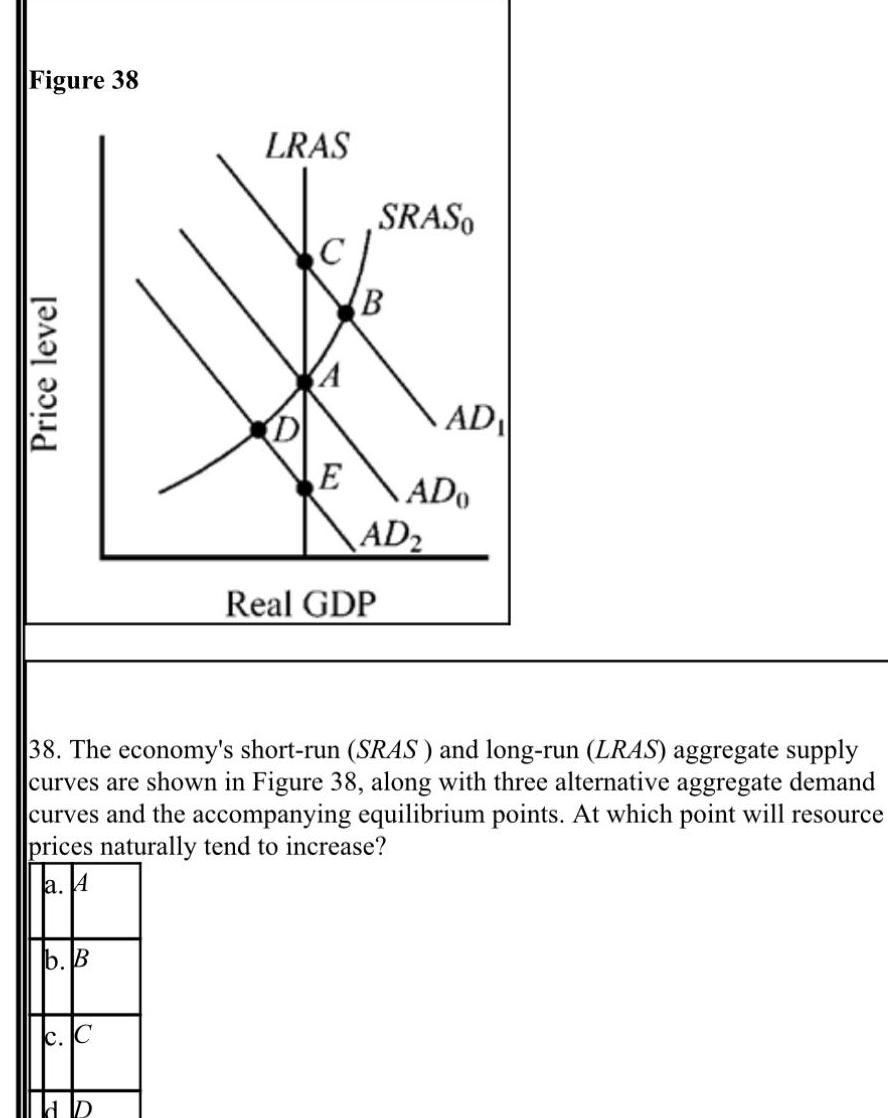

Figure 38 Price level b B C LRAS C D C E SRASO B Real GDP AD 38 The economy s short run SRAS and long run LRAS aggregate supply curves are shown in Figure 38 along with three alternative aggregate demand curves and the accompanying equilibrium points At which point will resource prices naturally tend to increase a A AD ADO
Step by Step Solution
There are 3 Steps involved in it
1 Expert Approved Answer
Step: 1 Unlock

Question Has Been Solved by an Expert!
Get step-by-step solutions from verified subject matter experts
Step: 2 Unlock
Step: 3 Unlock