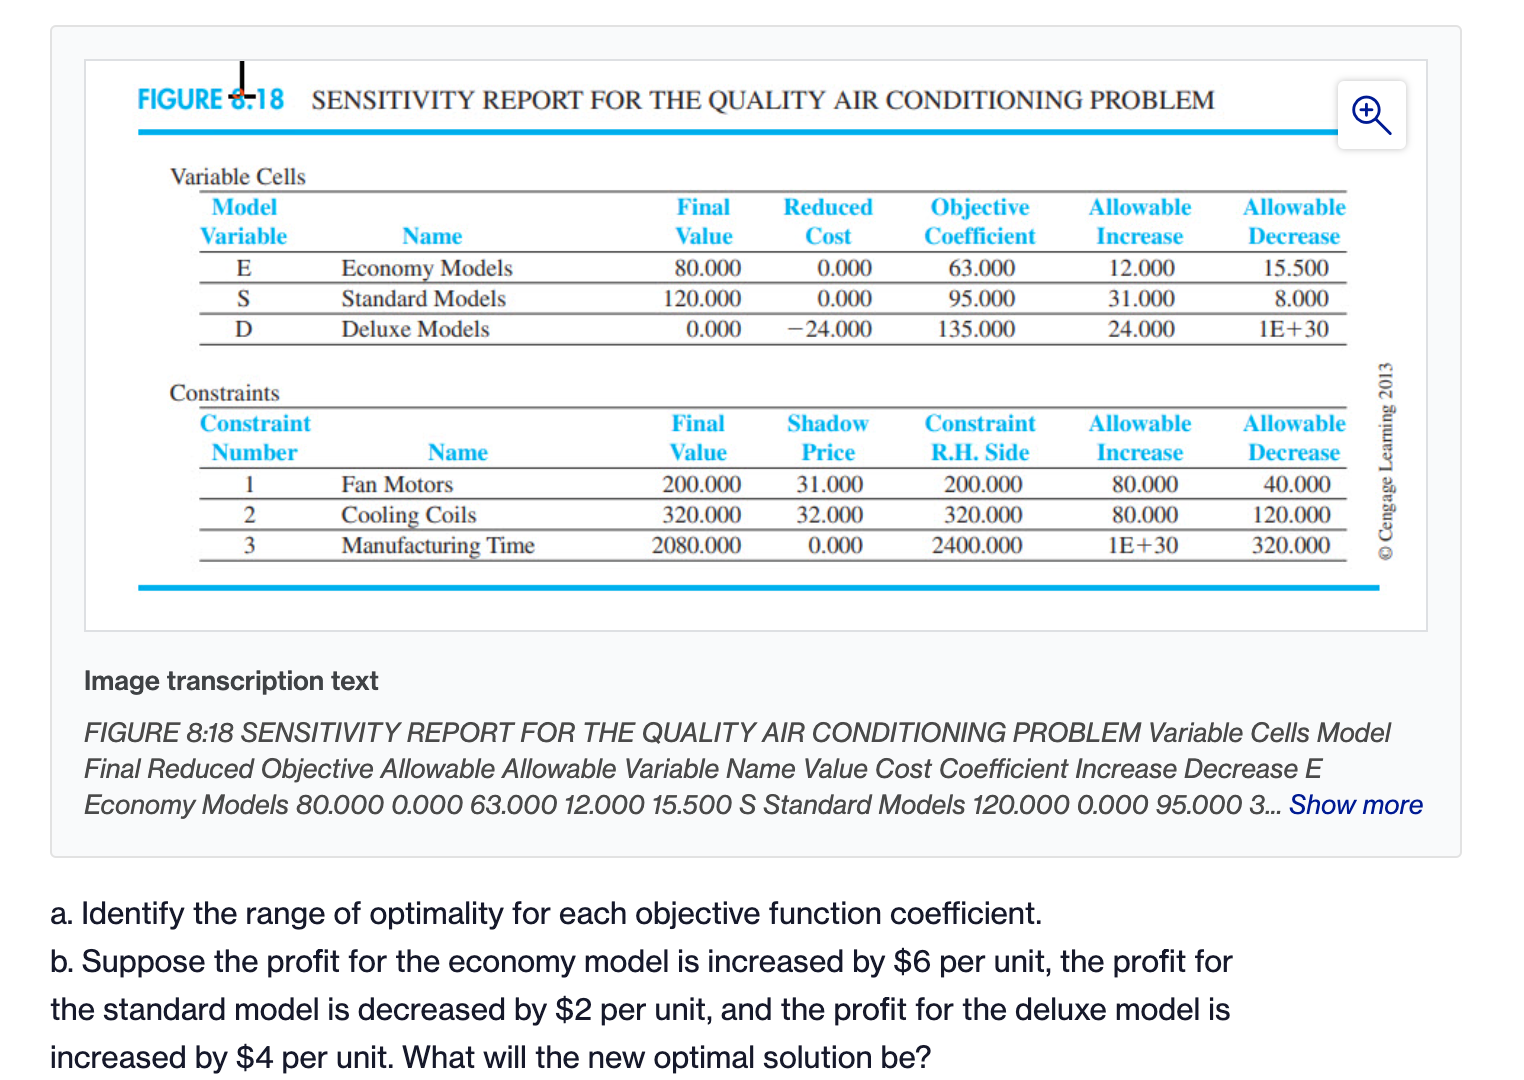
Question: FIGURE 4:18 SENSITIVITY REPORT FOR THE QUALITY AIR CONDITIONING PROBLEM Variable Cells Model Final Reduced Objective Allowable Allowable Variable Name Value Cost Coefficient Increase Decrease

FIGURE 4:18 SENSITIVITY REPORT FOR THE QUALITY
FIGURE 4:18 SENSITIVITY REPORT FOR THE QUALITY AIR CONDITIONING PROBLEM Variable Cells Model Final Reduced Objective Allowable Allowable Variable Name Value Cost Coefficient Increase Decrease E Economy Models 80.000 0.000 63.000 [2.000 l5.500 S Standard Models 120.000 0.000 95.000 31.000 8.000 D Deluxe Models 0.000 24.000 135.000 24.000 1E+30 Constraints Constraint Final Shadow Constraint Allowable Allowable Number Name Value Price R.H. Side Increase Decrease 1 Fan Motors 200.000 31.000 200.000 80.000 40.000 2 Cooling Coils 320.000 32.000 320.000 80.000 120.000 3 Manufacturing Tune 2080.000 0.000 2400.000 IE+30 320.000 Image transcription text a (litmus: Learning 20I3 FIGURE 8:18 SENSITIVITY REPORT FOR THE QUALITYAIR CONDITIONING PROBLEM VariabIe CeIIs Model Final Reduced Objective Allowable Allowable Variable Name Value Cost Coefficient increase Decrease E Economy Models 80.000 0.000 63.000 12.000 15.500 8 Standard Models 120.000 0.000 95.000 3... Show more a. Identify the range of optimality for each objective function coefficient. b. Suppose the profit for the economy model is increased by $6 per unit, the profit for the standard model is decreased by $2 per unit, and the profit for the deluxe model is increased by $4 per unit. What will the new optimal solution be

Step by Step Solution

There are 3 Steps involved in it

1 Expert Approved Answer
Step: 1 Unlock blur-text-image
Question Has Been Solved by an Expert!

Get step-by-step solutions from verified subject matter experts

Step: 2 Unlock
Step: 3 Unlock

Students Have Also Explored These Related Mathematics Questions!