

Question: Figure 4.57 illustrates the Bayesian network for the data set shown in Table 4.11. (Assume that all the attributes are binary). (a) Draw the probability
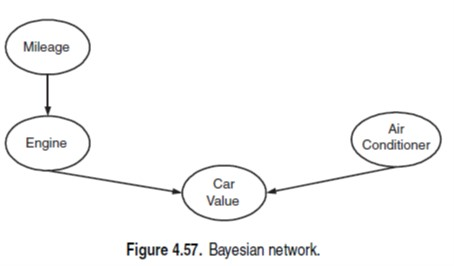
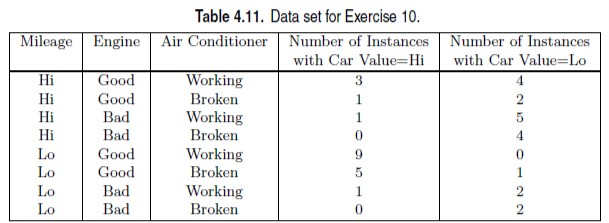
Figure 4.57 illustrates the Bayesian network for the data set shown in Table 4.11. (Assume that all the attributes are binary). (a) Draw the probability table for each node in the network. (b) Use the Bayesian network to compute P(Engine = Bad, Air Conditioner = Broken).
Mileage Air Conditioner Engine Car Value Figure 4.57. Bayesian network. Table 4.11. Data set for Exercise 10 MileageEngineAir ConditionerNumber of Instances Number of Instances with Car Value= Hi | with Car Value- Hi Hi Hi Lo Lo Lo Lo Good Good Bad Bad Good Good Bad Bad Working Broken Working Broken Working Broken Working Broken 0 Mileage Air Conditioner Engine Car Value Figure 4.57. Bayesian network. Table 4.11. Data set for Exercise 10 MileageEngineAir ConditionerNumber of Instances Number of Instances with Car Value= Hi | with Car Value- Hi Hi Hi Lo Lo Lo Lo Good Good Bad Bad Good Good Bad Bad Working Broken Working Broken Working Broken Working Broken 0
Step by Step Solution
There are 3 Steps involved in it

Get step-by-step solutions from verified subject matter experts