

Question: Figure 5 : Active High Pass Filter Circuit Diagram 2 . Consider the first order active highpass circuit illustrated in 5 with the input voltage
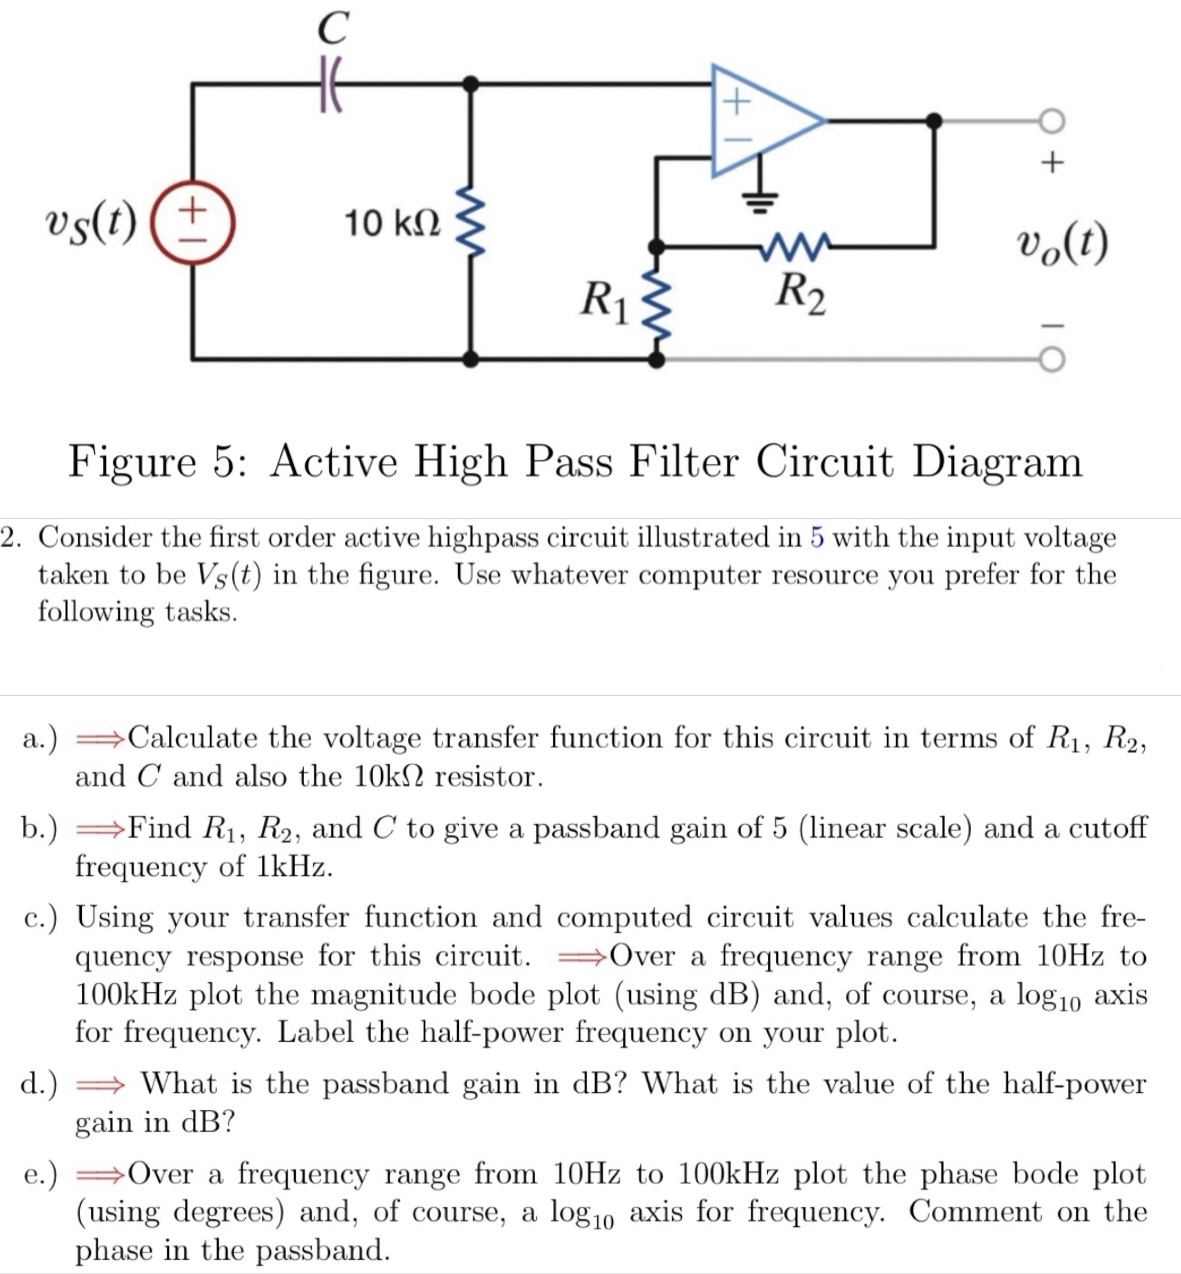
Figure : Active High Pass Filter Circuit Diagram
Consider the first order active highpass circuit illustrated in with the input voltage taken to be in the figure. Use whatever computer resource you prefer for the following tasks.
a Longrightarrow Calculate the voltage transfer function for this circuit in terms of and and also the resistor.
b Longrightarrow Find and to give a passband gain of linear scale and a cutoff frequency of kHz
c Using your transfer function and computed circuit values calculate the frequency response for this circuit. Longrightarrow Over a frequency range from Hz to kHz plot the magnitude bode plot using dB and, of course, a axis for frequency. Label the halfpower frequency on your plot.
d Longrightarrow What is the passband gain in dB What is the value of the halfpower gain in dB
e Longrightarrow Over a frequency range from Hz to kHz plot the phase bode plot using degrees and, of course, a axis for frequency. Comment on the phase in the passband.
Step by Step Solution
There are 3 Steps involved in it
1 Expert Approved Answer
Step: 1 Unlock

Question Has Been Solved by an Expert!
Get step-by-step solutions from verified subject matter experts
Step: 2 Unlock
Step: 3 Unlock