

Question: Figure 5 is a graphical representation of an optimization problem Maximize k1x1 + k2x2 subject to non-negativity and two constraints each of which can be
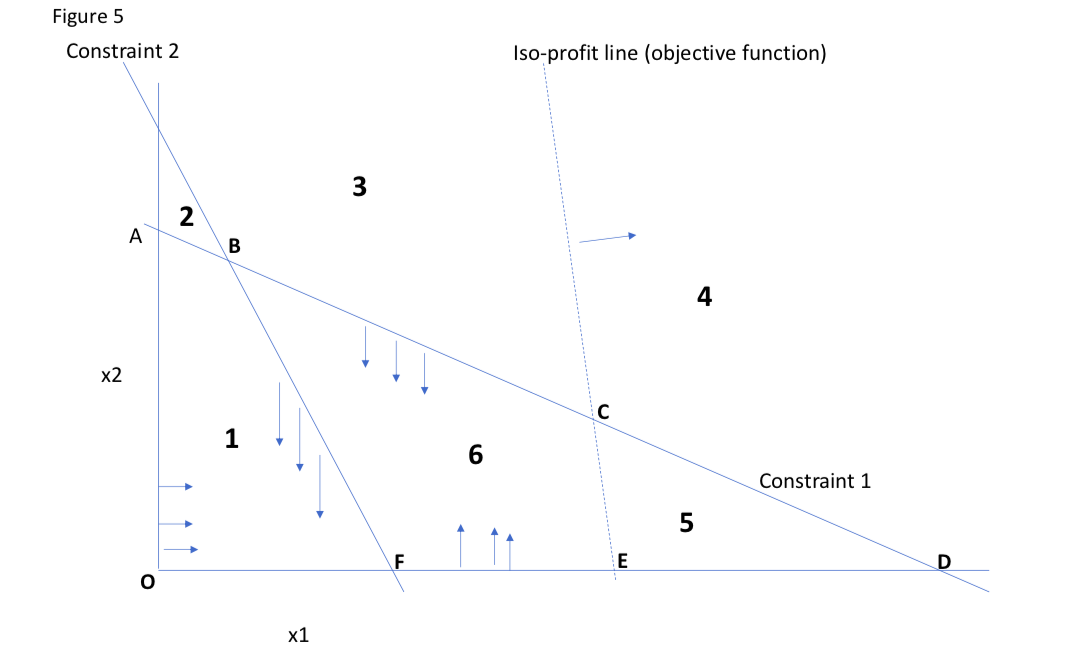 Figure 5 is a graphical representation of an optimization problem Maximize k1x1 + k2x2 subject to non-negativity and two constraints each of which can be expressed in the form m1x1 + m2x2
23. In figure 5, where is the optimal solution?
-
Point A
-
Point B
-
Point C
-
Point D
-
Point E
-
Point F
-
Point O
-
None of the above
Step by Step Solution
There are 3 Steps involved in it
1 Expert Approved Answer
Step: 1 Unlock

Question Has Been Solved by an Expert!
Get step-by-step solutions from verified subject matter experts
Step: 2 Unlock
Step: 3 Unlock