

Question: Figure 5: On the Go Stores, Scatterplot of Sales versus Average Number of Employees Correlation between Sales and Number of Employees 2.500,000 PL=0:6092 O 2000
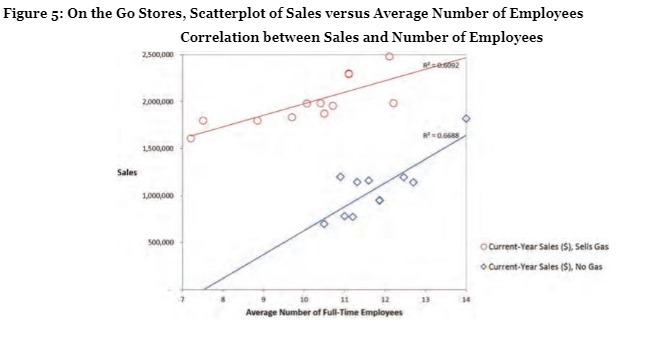
Figure 5: On the Go Stores, Scatterplot of Sales versus Average Number of Employees Correlation between Sales and Number of Employees 2.500,000 PL=0:6092 O 2000 000 O O 1.500,000 Sales 1000 000 500.000 O Current-Year Sales (5). Sells Gas Current-Year Sales (5), No Gas 10 11 13 14 Average Number of Full-Time Employees
Step by Step Solution
There are 3 Steps involved in it
1 Expert Approved Answer
Step: 1 Unlock

Question Has Been Solved by an Expert!
Get step-by-step solutions from verified subject matter experts
Step: 2 Unlock
Step: 3 Unlock