

Question: Figure 5. Summary output from a simple linear regression analysis produced by Excel. The results are organized in three tables - 1) regression statistics including
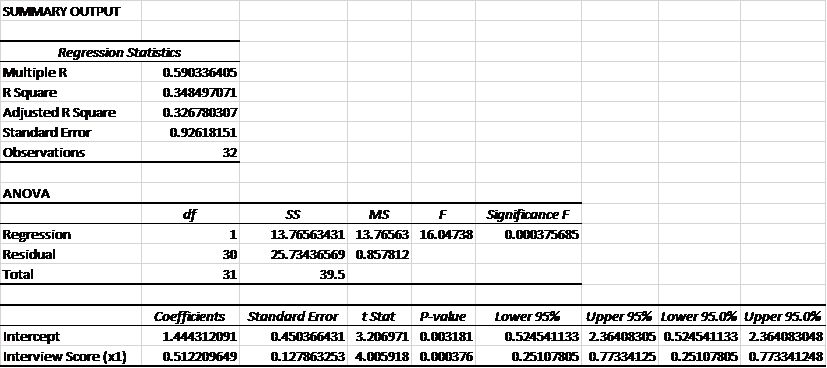
Figure 5.Summary output from a simple linear regression analysis produced by Excel. The results are organized in three tables - 1) regression statistics including the R squared, standard error, and number of observations, 2) ANOVA F-tests for the regression model and residuals, 3) and significance tests for the coefficients.
For additional guidance regarding how to calculate simple linear regression analyses and interpret regression results in Excel, see the video located in your Week 6 course resources.
- Are the results significant? Explain your response.
- Use the summary output to find the least square regression line: y = ax + b
- Jeff Jones has an interview score of 3.4. Estimate the value of y (performance) when x = 3.4.
\f
Step by Step Solution
There are 3 Steps involved in it
1 Expert Approved Answer
Step: 1 Unlock

Question Has Been Solved by an Expert!
Get step-by-step solutions from verified subject matter experts
Step: 2 Unlock
Step: 3 Unlock