

Question: Figure 5.1: Case Processing Summary Cases Valid Missing Total Hospitals N Percent N Percent N Percent Employee_satisfaction_score Johannesburg 30 100.0% 0 0.0% 30 100.0%
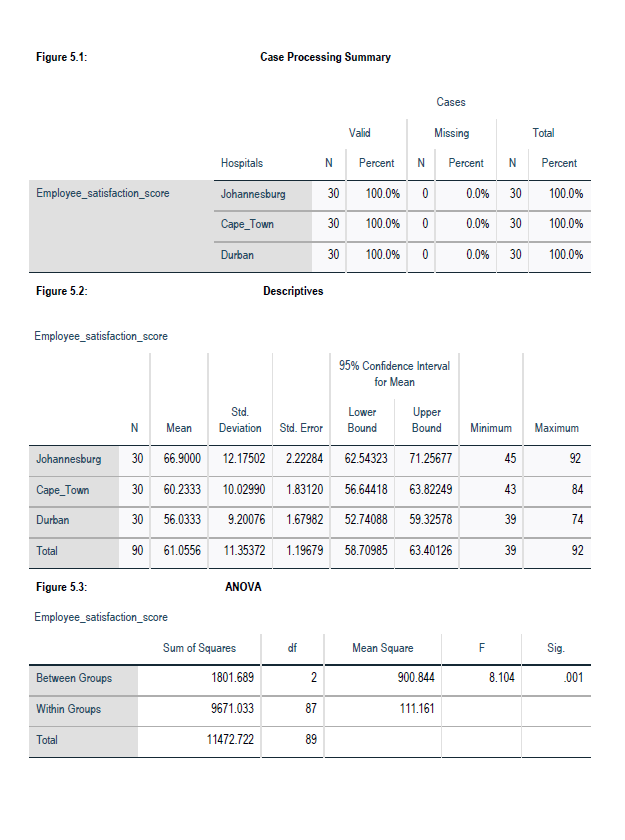
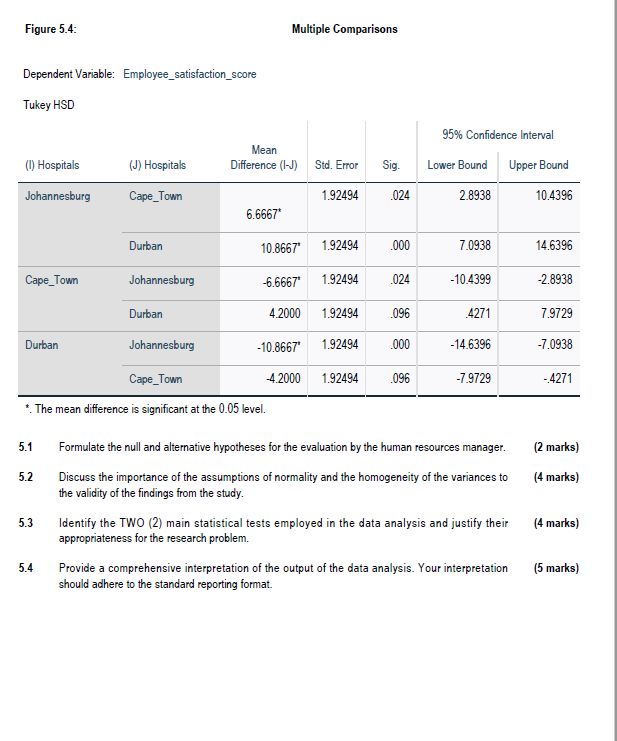
Figure 5.1: Case Processing Summary Cases Valid Missing Total Hospitals N Percent N Percent N Percent Employee_satisfaction_score Johannesburg 30 100.0% 0 0.0% 30 100.0% Cape Town 30 100.0% 0 0.0% 30 100.0% Durban 30 100.0% 0 0.0% 30 100.0% Figure 5.2: Employee_satisfaction_score Descriptives 95% Confidence Interval for Mean N Mean Std. Deviation Lower Upper Std. Error Bound Bound Minimum Maximum Johannesburg 30 66.9000 12.17502 2.22284 62.54323 71.25677 45 92 Cape Town 30 60.2333 10.02990 1.83120 56.64418 63.82249 43 84 Durban 30 56.0333 9.20076 1.67982 52.74088 59.32578 39 99 74 Total 90 61.0556 11.35372 1.19679 58.70985 63.40126 39 99 92 Figure 5.3: ANOVA Employee_satisfaction_score Sum of Squares df Mean Square F Sig. Between Groups 1801.689 2 900.844 8.104 .001 Within Groups 9671.033 87 111.161 Total 11472.722 89 Figure 5.4: Dependent Variable: Employee_satisfaction_score Tukey HSD Multiple Comparisons 95% Confidence Interval Mean (I) Hospitals (J) Hospitals Difference (I-J) Std. Error Sig. Lower Bound Upper Bound Johannesburg Cape Town 1.92494 .024 2.8938 10.4396 6.6667* Durban 10.8667' 1.92494 .000 7.0938 14.6396 Cape Town Johannesburg -6.6667" 1.92494 .024 -10.4399 -2.8938 Durban 4.2000 1.92494 .096 4271 7.9729 Durban Johannesburg -10.8667' 1.92494 .000 -14.6396 -7.0938 Cape Town -4.2000 1.92494 .096 -7.9729 -4271 *. The mean difference is significant at the 0.05 level. 5.1 Formulate the null and alternative hypotheses for the evaluation by the human resources manager. (2 marks) 5.2 Discuss the importance of the assumptions of normality and the homogeneity of the variances to the validity of the findings from the study. (4 marks) 5.3 Identify the TWO (2) main statistical tests employed in the data analysis and justify their appropriateness for the research problem. (4 marks) 5.4 Provide a comprehensive interpretation of the output of the data analysis. Your interpretation should adhere to the standard reporting format. (5 marks)
Step by Step Solution
There are 3 Steps involved in it

Get step-by-step solutions from verified subject matter experts