

Question: ] Figure 6: The correlation coefficient and construct the inter-asset correlation matrix for these assets over 1985- 2019 Direct property Office Retail Industrial Shares Bonds
![] Figure 6: The correlation coefficient and construct the inter-asset correlation](https://s3.amazonaws.com/si.experts.images/answers/2024/06/6661ef3c1e8b7_2676661ef3bf0ccb.jpg)
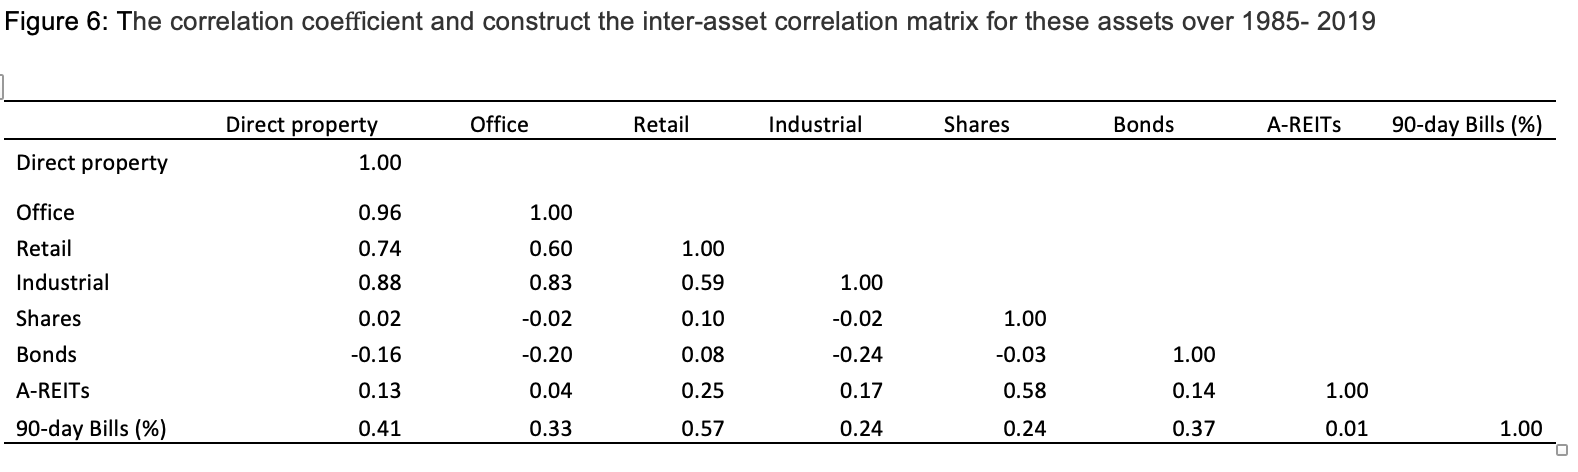
] Figure 6: The correlation coefficient and construct the inter-asset correlation matrix for these assets over 1985- 2019 Direct property Office Retail Industrial Shares Bonds AREITs 90-day Bills (96) Direct property 1.00 0.96 0.74 0.38 0.02 -0.16 0.13 0.41 Office 1.00 0.60 0.83 -0.02 -0.20 0.04 0.33 Retail 1.00 0.59 0.10 0.08 0.25 0.57 Industrial 1.00 -0.02 0.24 0. 17 0.24 Shares 1.00 -0.03 0.58 0.24 Bonds 1.00 0.14 0.37 AREITs 1.00 0.01 90day Bills (96} 1.00
Step by Step Solution
There are 3 Steps involved in it
1 Expert Approved Answer
Step: 1 Unlock

Question Has Been Solved by an Expert!
Get step-by-step solutions from verified subject matter experts
Step: 2 Unlock
Step: 3 Unlock