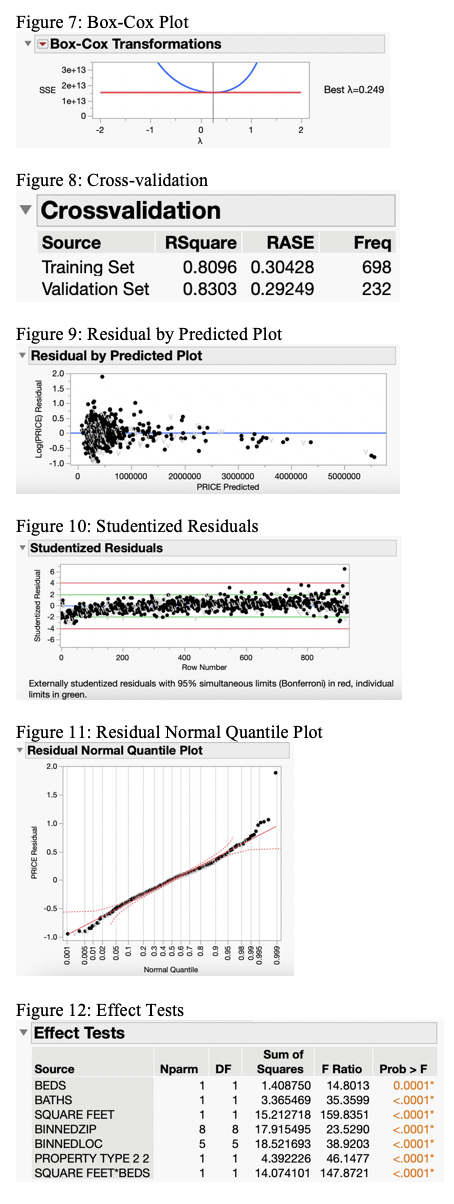
Question: Figure 7: Box-Cox Plot Box-Cox Transformations 3e+13 SSE 20+13 Best A=0.249 10+13 Figure 8: Cross-validation Crossvalidation Source RSquare RASE Freq Training Set 0.8096 0.30428 698

Figure 7: Box-Cox Plot Box-Cox Transformations
Figure 7: Box-Cox Plot Box-Cox Transformations 3e+13 SSE 20+13 Best A=0.249 10+13 Figure 8: Cross-validation Crossvalidation Source RSquare RASE Freq Training Set 0.8096 0.30428 698 Validation Set 0.8303 0.29249 232 Figure 9: Residual by Predicted Plot Residual by Predicted Plot 2.0 1.0 Log(PRICE) Residual 0.5 .. 0.5 -1.0 1000000 2000000 3000000 4000000 5000000 PRICE Predicted Figure 10: Studentized Residuals Studentized Residuals NONAS Studentized Residual 200 400 6OO 800 Row Number Externally studentized residuals with 95% simultaneous limits (Bonferroni) in red, individual limits in green. Figure 11: Residual Normal Quantile Plot Residual Normal Quantile Plot 2.0 1.5 1.0 05 PRICE Residua 10- 0.5- 0.01- 0.02 0.99 0.005 0.98 0.995 0.001 0.909 Normal Quantile Figure 12: Effect Tests Effect Tests Sum of Source Nparm DF Squares F Ratio Prob > F BEDS 1.408750 14.8013 0.0001* FT BATHS 3.365469 35.3599 <.0001 square feet binnedzip binnedloc property type>

Step by Step Solution

There are 3 Steps involved in it

1 Expert Approved Answer
Step: 1 Unlock blur-text-image
Question Has Been Solved by an Expert!

Get step-by-step solutions from verified subject matter experts

Step: 2 Unlock
Step: 3 Unlock

Students Have Also Explored These Related Mathematics Questions!