

Question: Figure 7-6 as guided Please be clean and nice. make sure draw the earned value chart and show step thank you ! Given the following
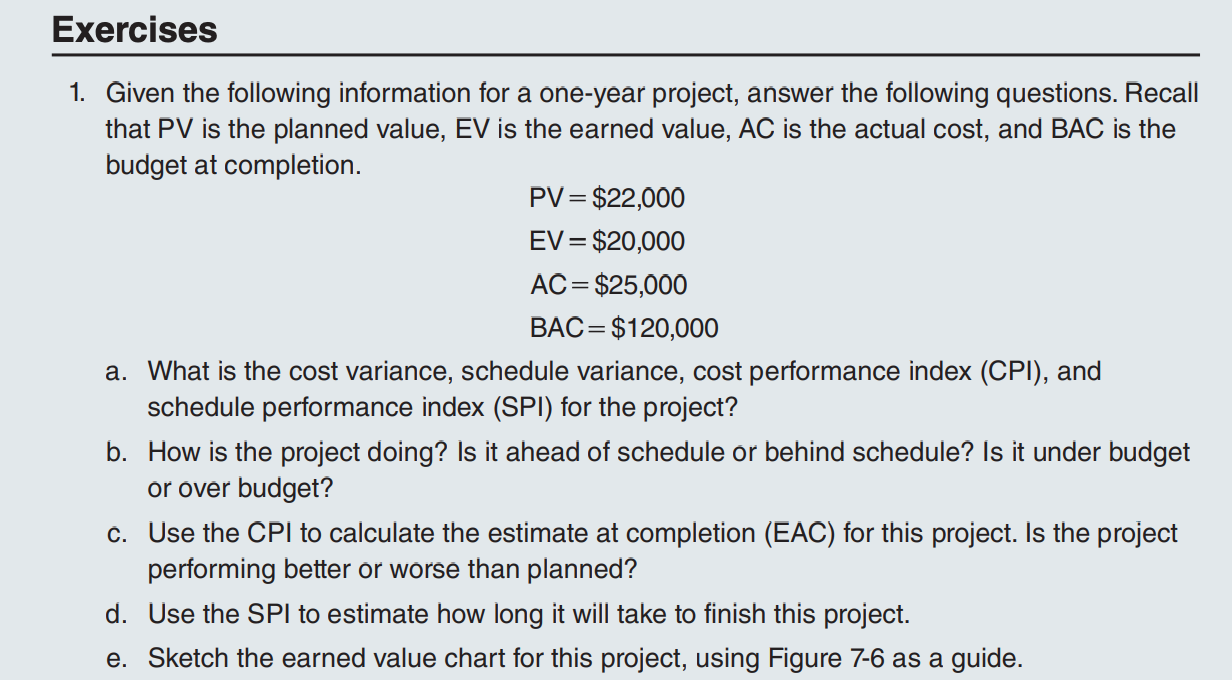
Figure 7-6 as guided
Please be clean and nice.
make sure draw the earned value chart and show step
thank you !
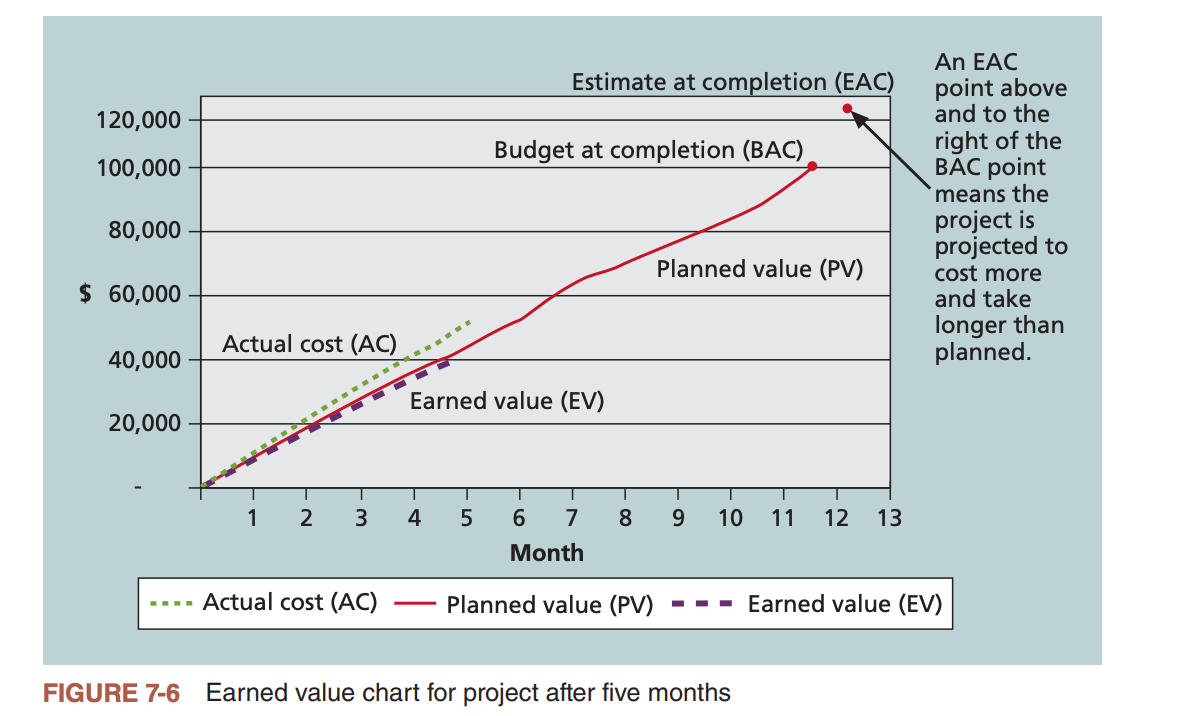
Given the following information for a one-year project, answer the following questions. Recall that PV is the planned value, EV is the earned value, AC is the actual cost, and BAC is the budget at completion. PV=$22,000EV=$20,000AC=$25,000BAC=$120,000 a. What is the cost variance, schedule variance, cost performance index (CPI), and schedule performance index (SPI) for the project? b. How is the project doing? Is it ahead of schedule or behind schedule? Is it under budget or over budget? c. Use the CPI to calculate the estimate at completion (EAC) for this project. Is the project performing better or worse than planned? d. Use the SPI to estimate how long it will take to finish this project. e. Sketch the earned value chart for this project, using Figure 7-6 as a guide. FIGURE 7-6 Earned value chart for project after five monthsStep by Step Solution
There are 3 Steps involved in it
1 Expert Approved Answer
Step: 1 Unlock

Question Has Been Solved by an Expert!
Get step-by-step solutions from verified subject matter experts
Step: 2 Unlock
Step: 3 Unlock