

Question: FIGURE 8.49 Control Chart Selection Quality characteristic Variable Attribute Type of attribute x - and moving range no charts Defective Defect n >10 or Constant
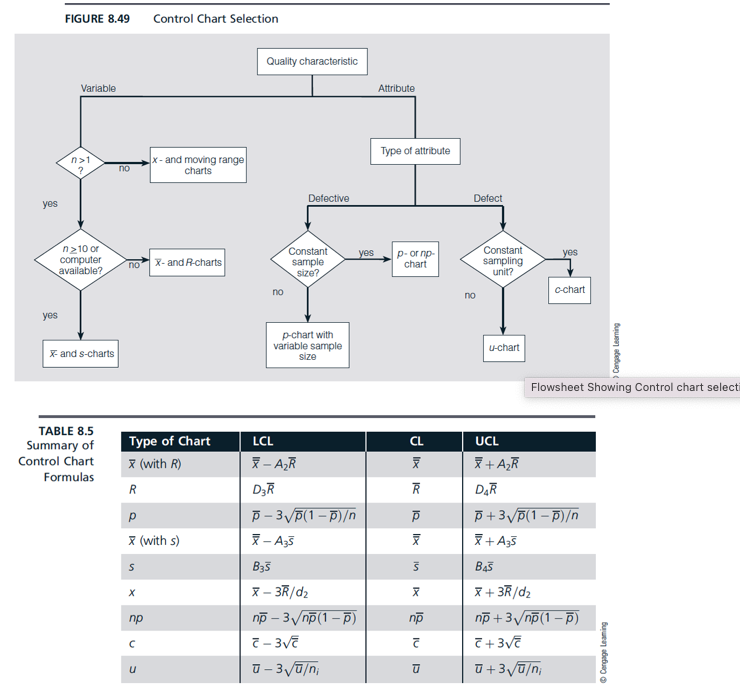
FIGURE 8.49 Control Chart Selection Quality characteristic Variable Attribute Type of attribute x - and moving range no charts Defective Defect n >10 or Constant yes Constant ves computer P- or np no X- and R-charts sample sampling available? chart size? unit? c-chart yes p-chart with variable sample U-chart Cengage Learning *- and s-charts Size Flowsheet Showing Control chart select TABLE 8.5 Summary of Type of Chart LCL CL UCL Control Chart * (with R) - AZR * + AZR Formulas R R DAR P p - 3vp(1 -p) p p +3vp(1 -p) (with s) 7 - A35 F * + A35 5 Ba5 B45 Y X - 3R/dz x + 3R/dz no np - 3vnp(1 -p) np np + 3vnp(1 -p) C 7 -3V/7 7 +3V/2 Cengage Leaming 7 - 3vu; 7 + 3vu;:lll For variable data we often look at the variablitv WITHIN the samples. For this we could look at the RANGE or the Standard Deviation of the values in the sample. all Why would we choose RANGE over Standard Deviation of a Sample? [4 marks} b} Is there some guidelines we would use? {3 marks} c} When would you look at taking a very large sample {n=1UO or more}? [3 marks}
Step by Step Solution
There are 3 Steps involved in it

Get step-by-step solutions from verified subject matter experts