

Question: Figure A below presents the sampling points of temperature ( F ) . Using the IDW method, interpolate the temperature at the location of K
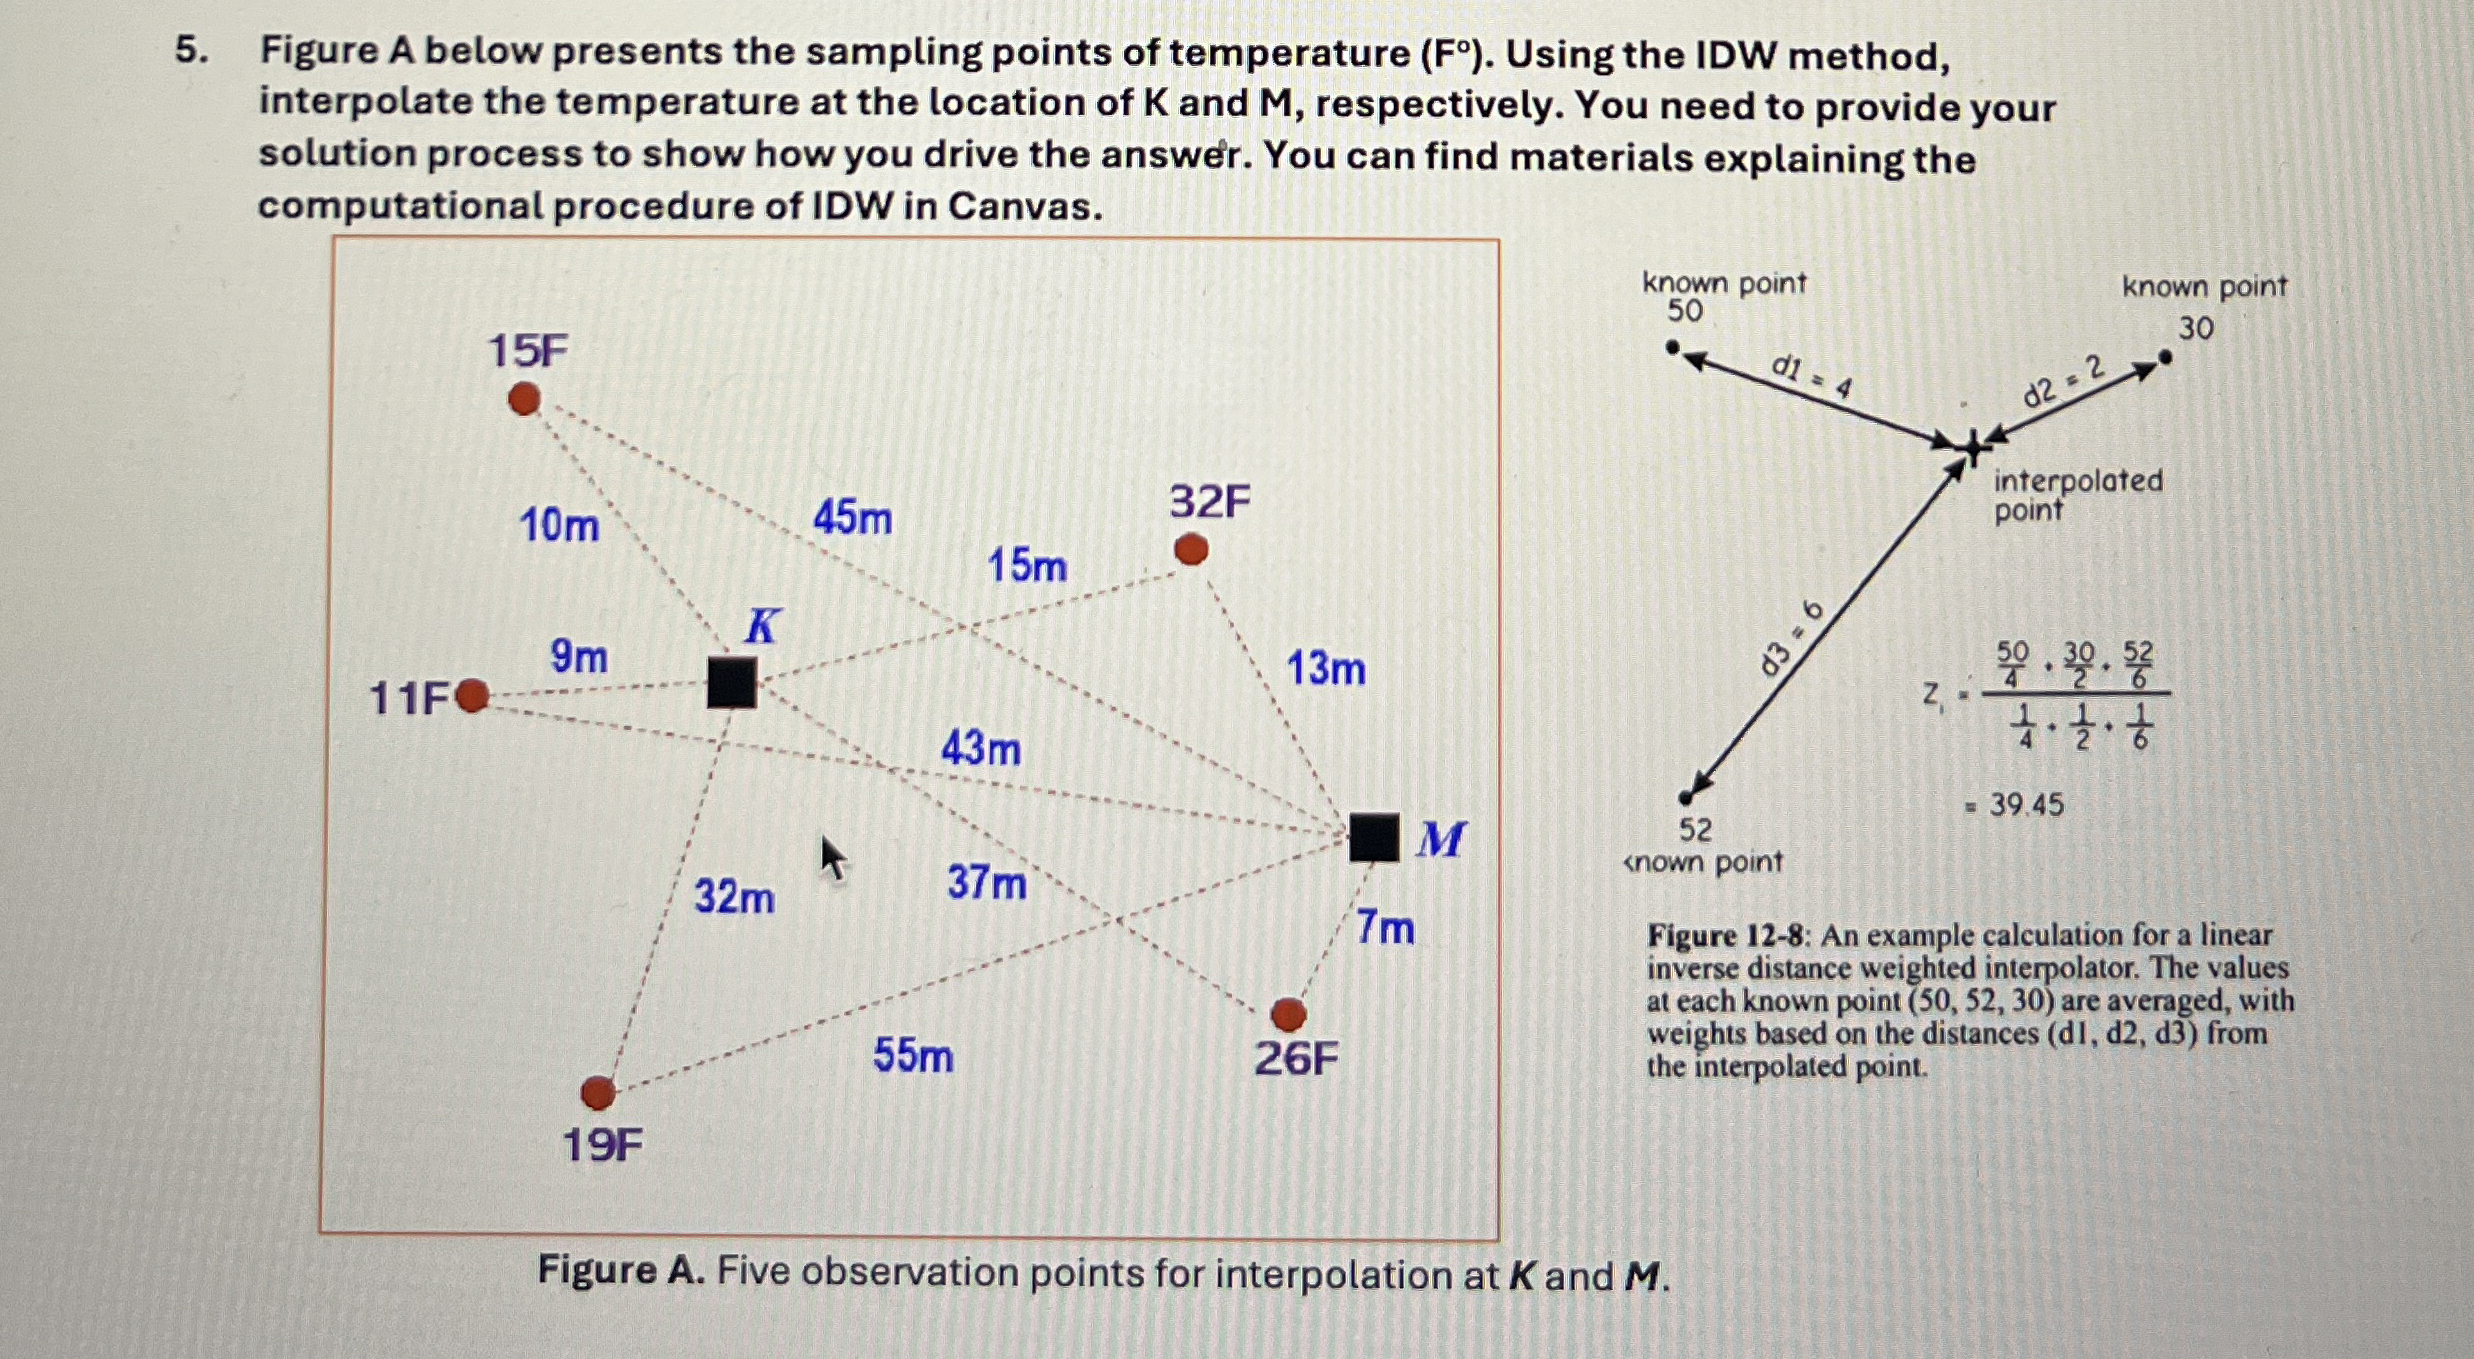
Figure A below presents the sampling points of temperature Using the IDW method, interpolate the temperature at the location of and respectively. You need to provide your solution process to show how you drive the answer. You can find materials explaining the computational procedure of IDW in Canvas.
Figure : An example calculation for a linear inverse distance weighted interpolator. The values at each known point are averaged, with weights based on the distances d d d from the interpolated point.
Figure A Five observation points for interpolation at and
Step by Step Solution
There are 3 Steps involved in it
1 Expert Approved Answer
Step: 1 Unlock

Question Has Been Solved by an Expert!
Get step-by-step solutions from verified subject matter experts
Step: 2 Unlock
Step: 3 Unlock