

Question: Figure below is a plot of logarithm of the diffusion coefficient versus the reciprocal of absolute temperature, on which is shown lines for four hypothetical
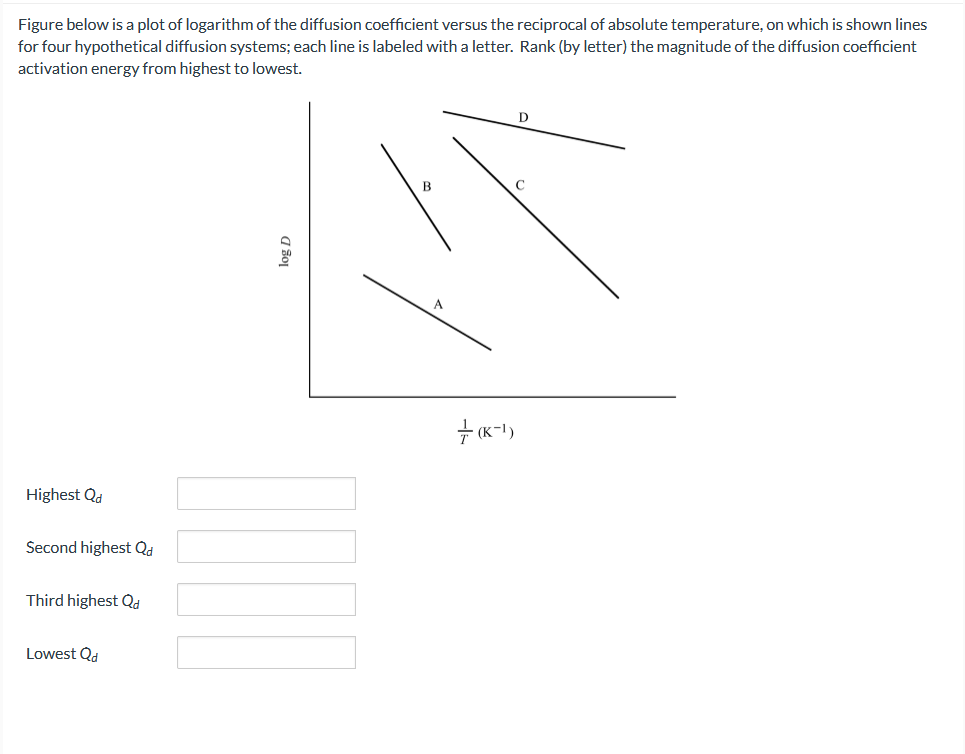
Figure below is a plot of logarithm of the diffusion coefficient versus the reciprocal of absolute temperature, on which is shown lines for four hypothetical diffusion systems; each line is labeled with a letter. Rank (by letter) the magnitude of the diffusion coefficient activation energy from highest to lowest. Highest Qd Second highest Qd Third highest Qd Lowest Qd
Step by Step Solution
There are 3 Steps involved in it
1 Expert Approved Answer
Step: 1 Unlock

Question Has Been Solved by an Expert!
Get step-by-step solutions from verified subject matter experts
Step: 2 Unlock
Step: 3 Unlock