

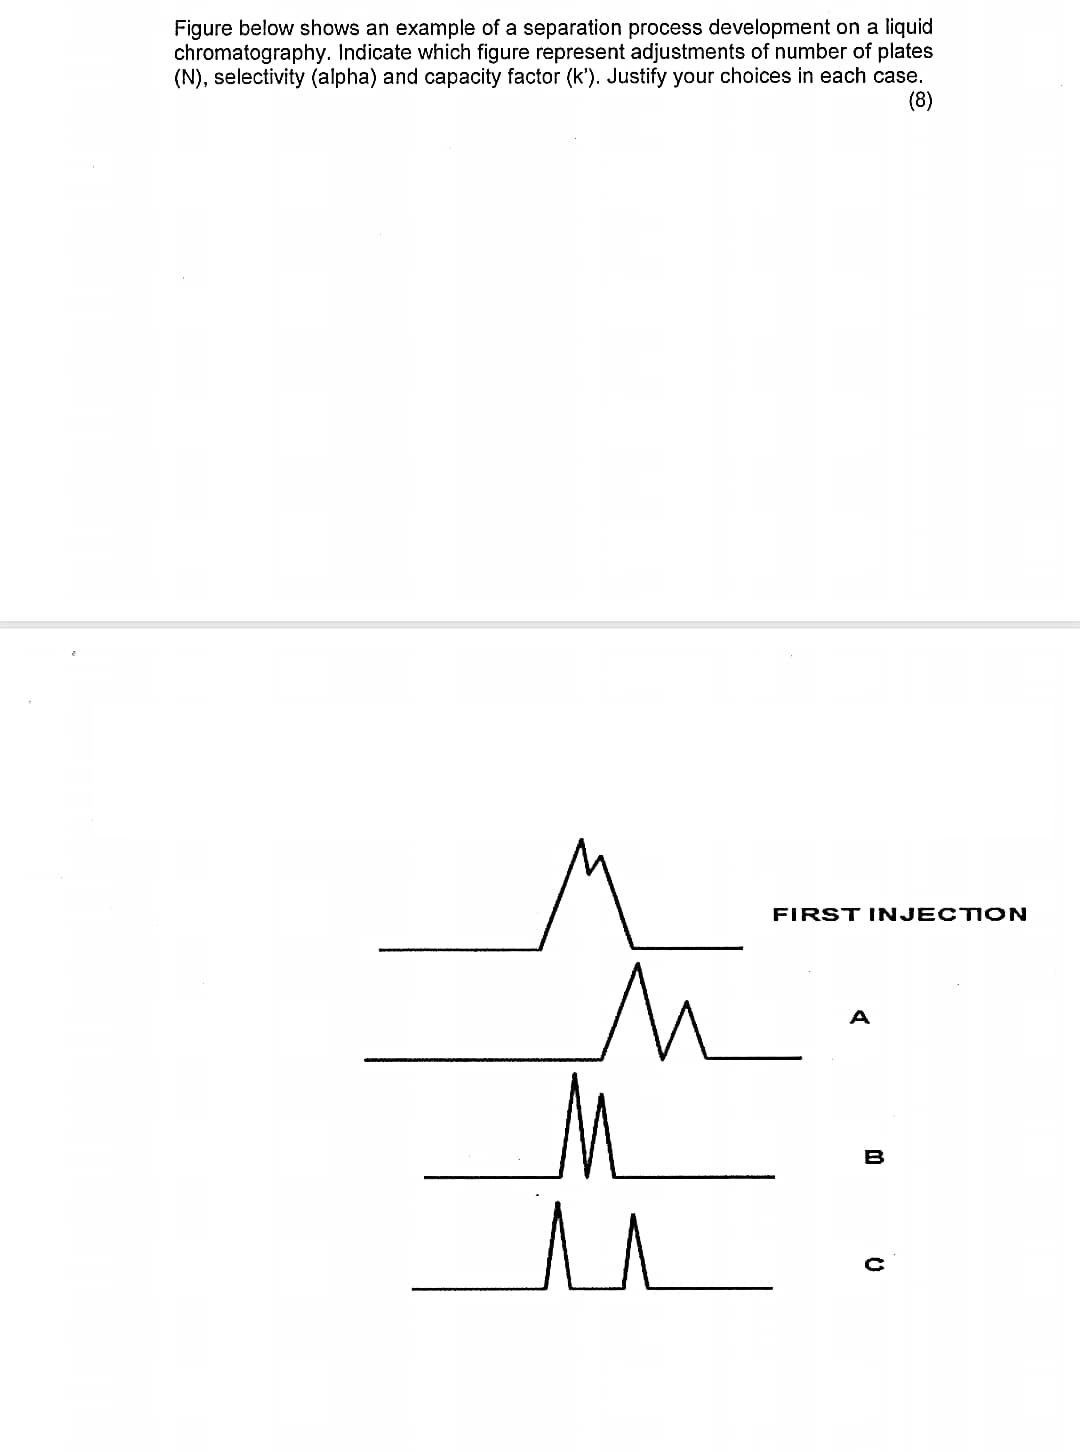
Question: Figure below shows an example of a separation process development on a liquid chromatography. Indicate which figure represent adjustments of number of plates ) ,
Figure below shows an example of a separation process development on a liquid chromatography. Indicate which figure represent adjustments of number of plates selectivity alpha and capacity factor Justify your choices in each case.
Step by Step Solution
There are 3 Steps involved in it
1 Expert Approved Answer
Step: 1 Unlock

Question Has Been Solved by an Expert!
Get step-by-step solutions from verified subject matter experts
Step: 2 Unlock
Step: 3 Unlock