

Question: (Figure: Market 2) Use the graph to answer the question. Marginal Price social cost Supply $12 $10 $8 $6 $4 $2 Demand o 6 8
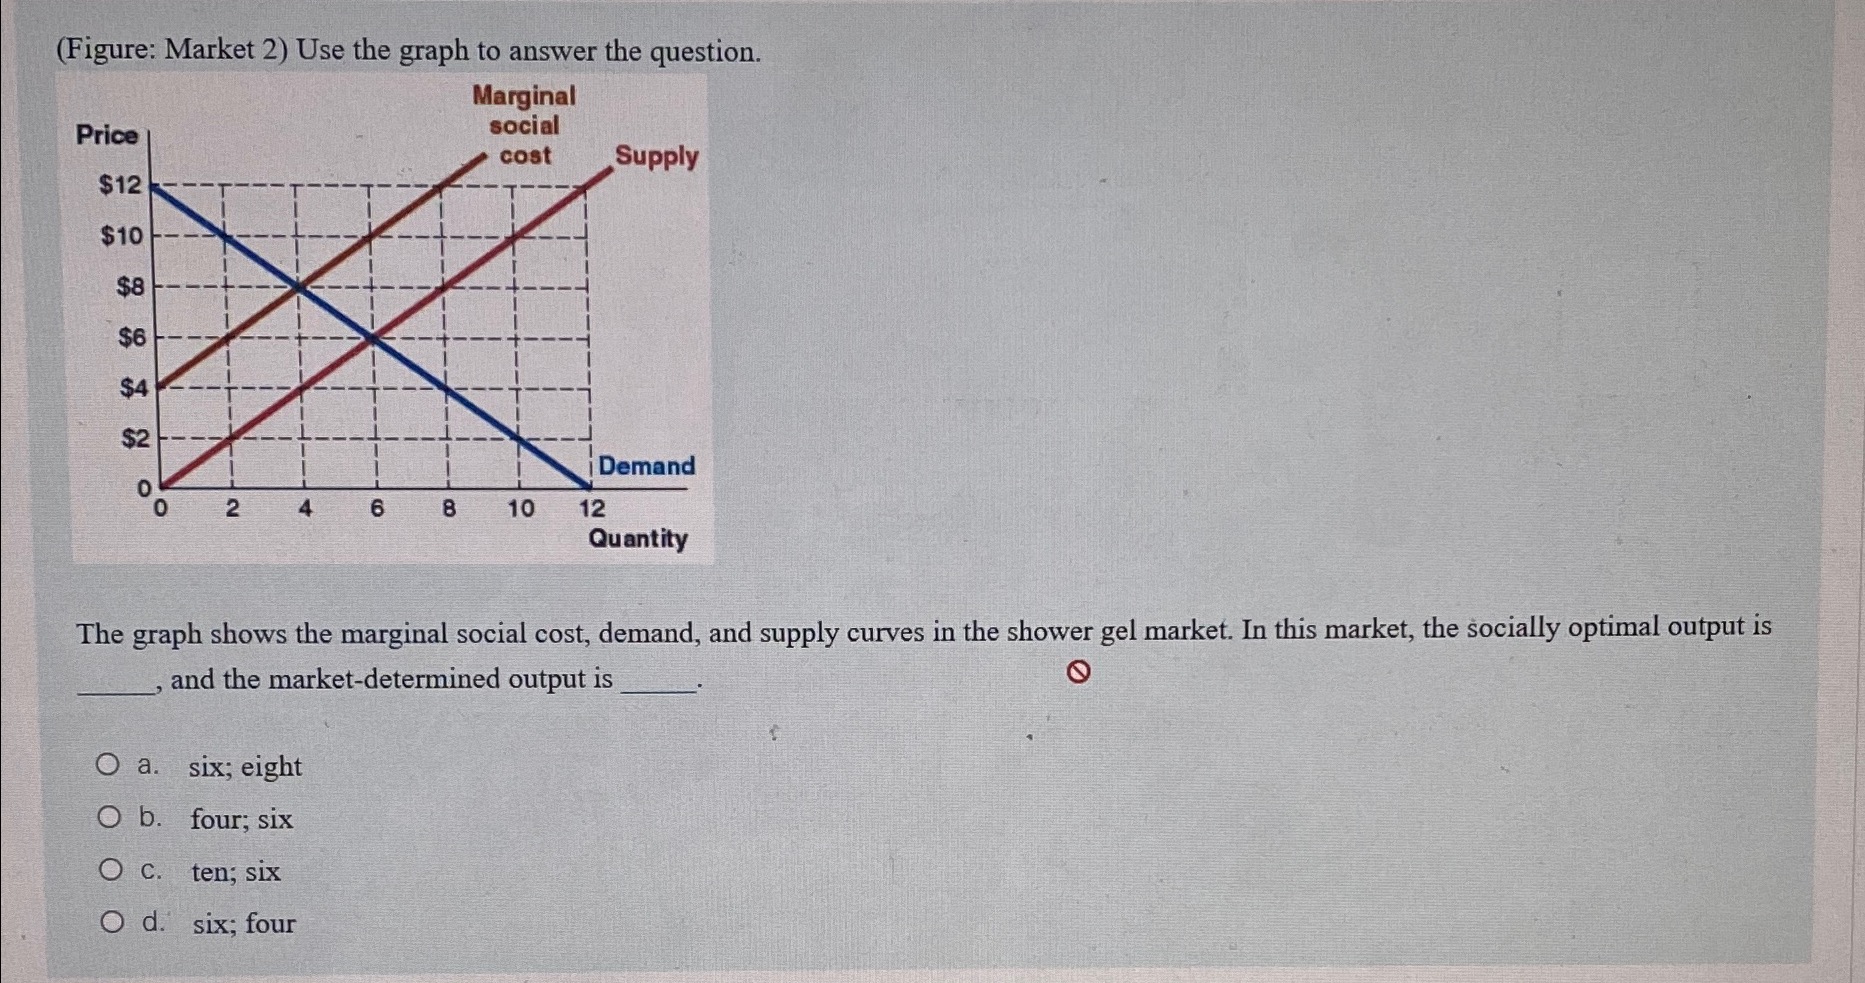
(Figure: Market 2) Use the graph to answer the question. Marginal Price social cost Supply $12 $10 $8 $6 $4 $2 Demand o 6 8 10 12 Quantity The graph shows the marginal social cost, demand, and supply curves in the shower gel market. In this market, the socially optimal output is and the market-determined output is O O a. six; eight O b. four; six O c. ten; six O d. six; four
Step by Step Solution
There are 3 Steps involved in it
1 Expert Approved Answer
Step: 1 Unlock

Question Has Been Solved by an Expert!
Get step-by-step solutions from verified subject matter experts
Step: 2 Unlock
Step: 3 Unlock