

Question: Figure Part D The graphs shown in ( Figure 1 ) represent the entirety of three separate pressure variation vs time recordings by a microphone.
Figure
Part D
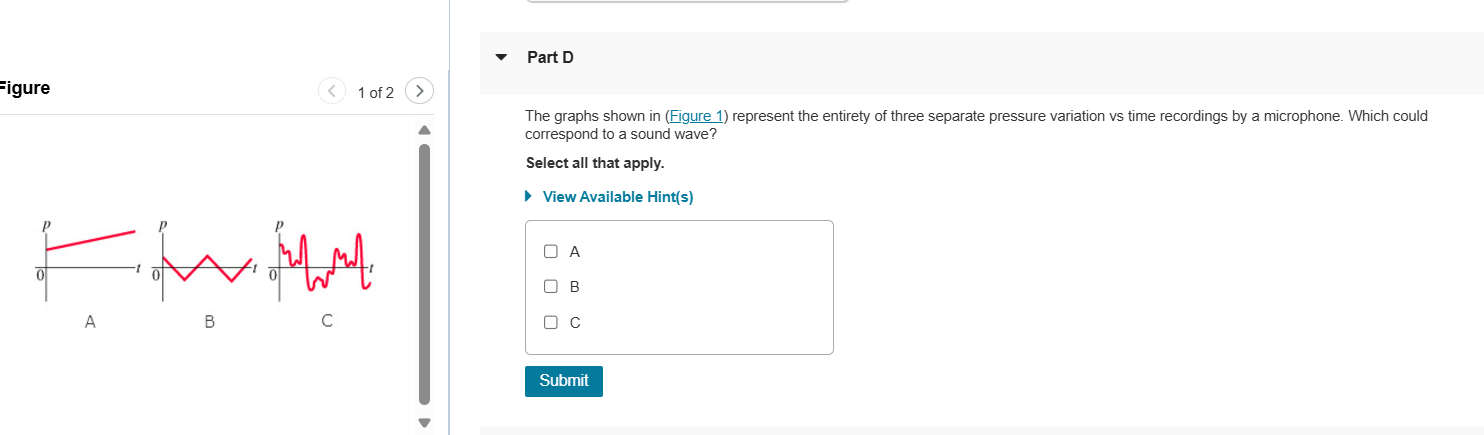
The graphs shown in Figure represent the entirety of three separate pressure variation vs time recordings by a microphone. Which could correspond to a sound wave?
Select all that apply.
View Available Hints
A
B
C
Step by Step Solution
There are 3 Steps involved in it
1 Expert Approved Answer
Step: 1 Unlock

Question Has Been Solved by an Expert!
Get step-by-step solutions from verified subject matter experts
Step: 2 Unlock
Step: 3 Unlock