

Question: ( Figure: Payoff Matrix for Blue Bottle and Opal Ocean ) Use Figure: Payoff Matrix for Blue Bottle and Opal Ocean. The figure shows the
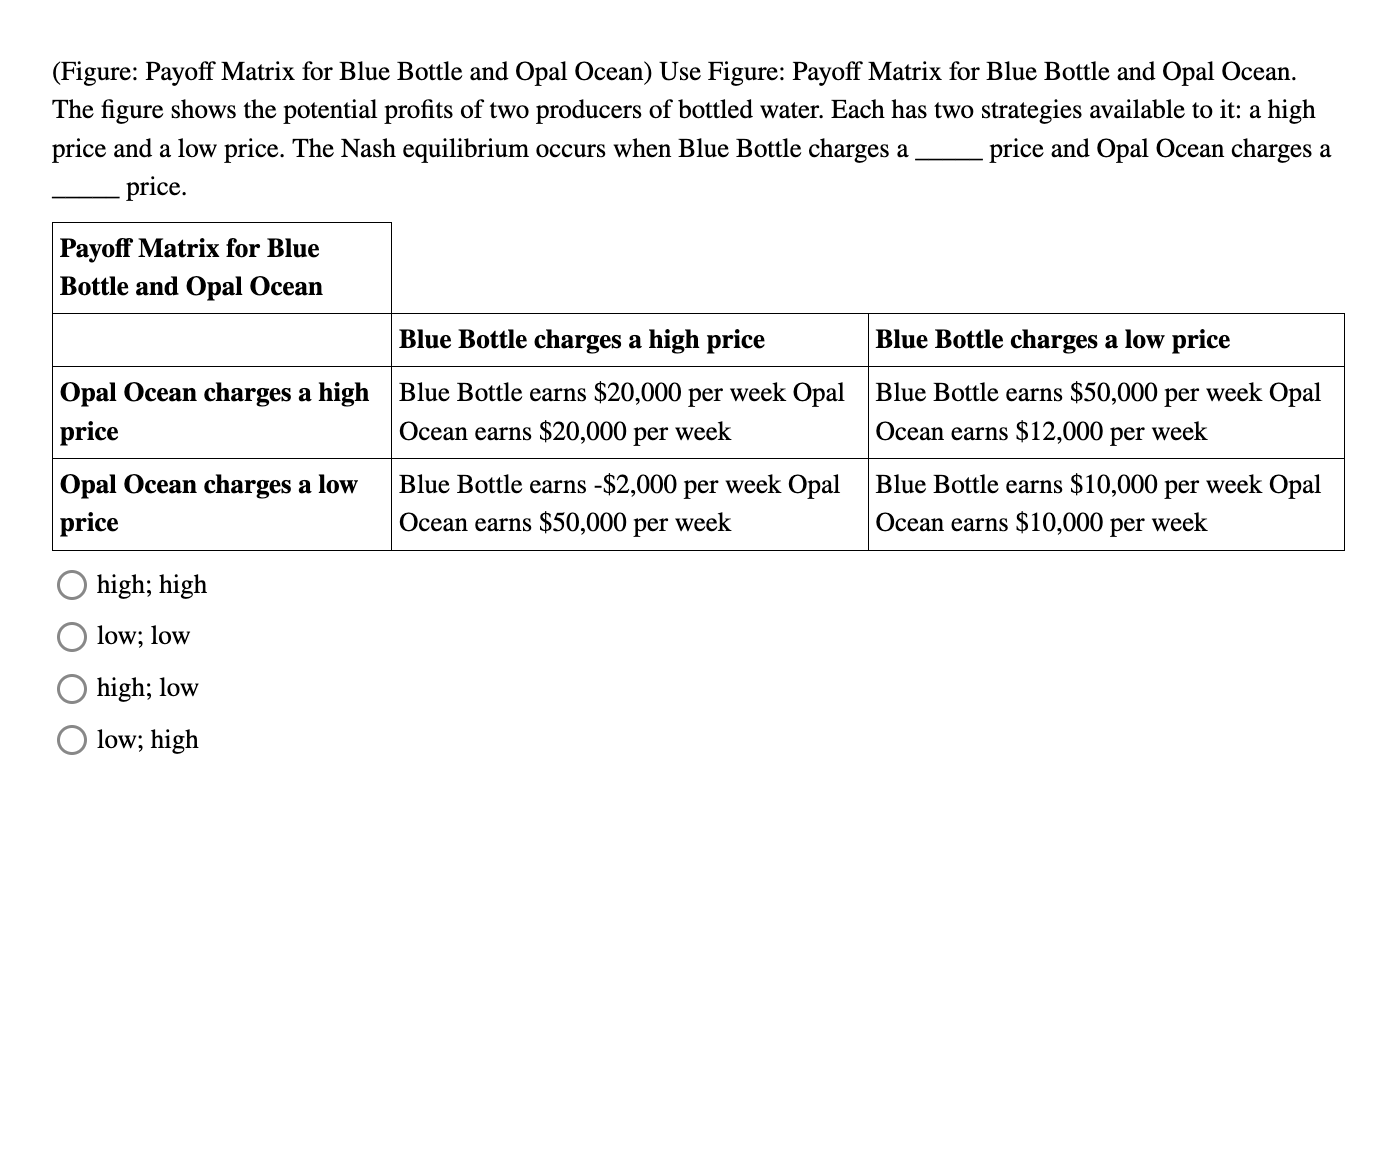
Figure: Payoff Matrix for Blue Bottle and Opal Ocean Use Figure: Payoff Matrix for Blue Bottle and Opal Ocean. The figure shows the potential profits of two producers of bottled water. Each has two strategies available to it: a high price and a low price. The Nash equilibrium occurs when Blue Bottle charges a price and Opal Ocean charges a
qquad price.
begintabularlll
hline begintabularl
Payoff Matrix for Blue
Bottle and Opal Ocean
endtabular & multicolumnc
hline & Blue Bottle charges a high price & Blue Bottle charges a low price
hline begintabularl
Opal Ocean charges a high
price
endtabular & begintabularl
Blue Bottle earns $ per week Opal
Ocean earns $ per week
endtabular & begintabularl
Blue Bottle earns $ per week Opal
Ocean earns $ per week
endtabular
hline begintabularl
Opal Ocean charges a low
price
endtabular & begintabularl
Blue Bottle earns $ per week Opal
Ocean earns $ per week
endtabular & begintabularl
Blue Bottle earns $ per week Opal
Ocean earns $ per week
endtabular
hline
endtabular
high; high
low; low
high; low
low; high
Step by Step Solution
There are 3 Steps involved in it
1 Expert Approved Answer
Step: 1 Unlock

Question Has Been Solved by an Expert!
Get step-by-step solutions from verified subject matter experts
Step: 2 Unlock
Step: 3 Unlock