

Question: Figure: Tree Graph Node 1 Node 2 Node 3 Figure: Tree Graph Review Figure: Tree Graph. In the tree depicted in this figure, which node
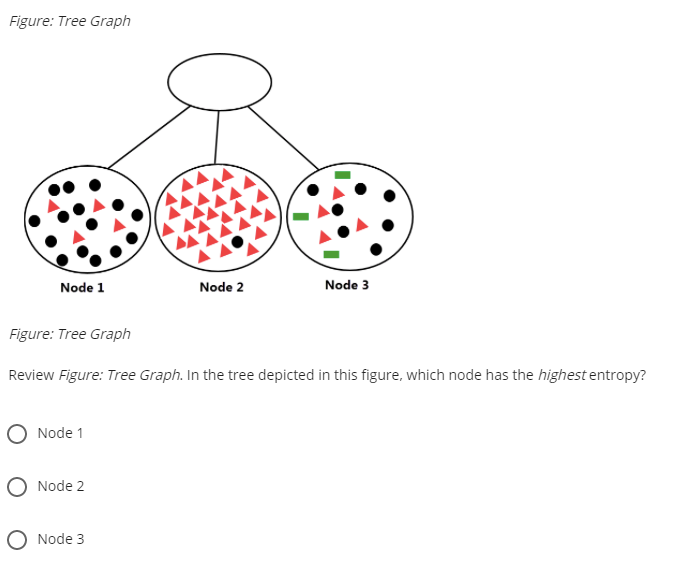
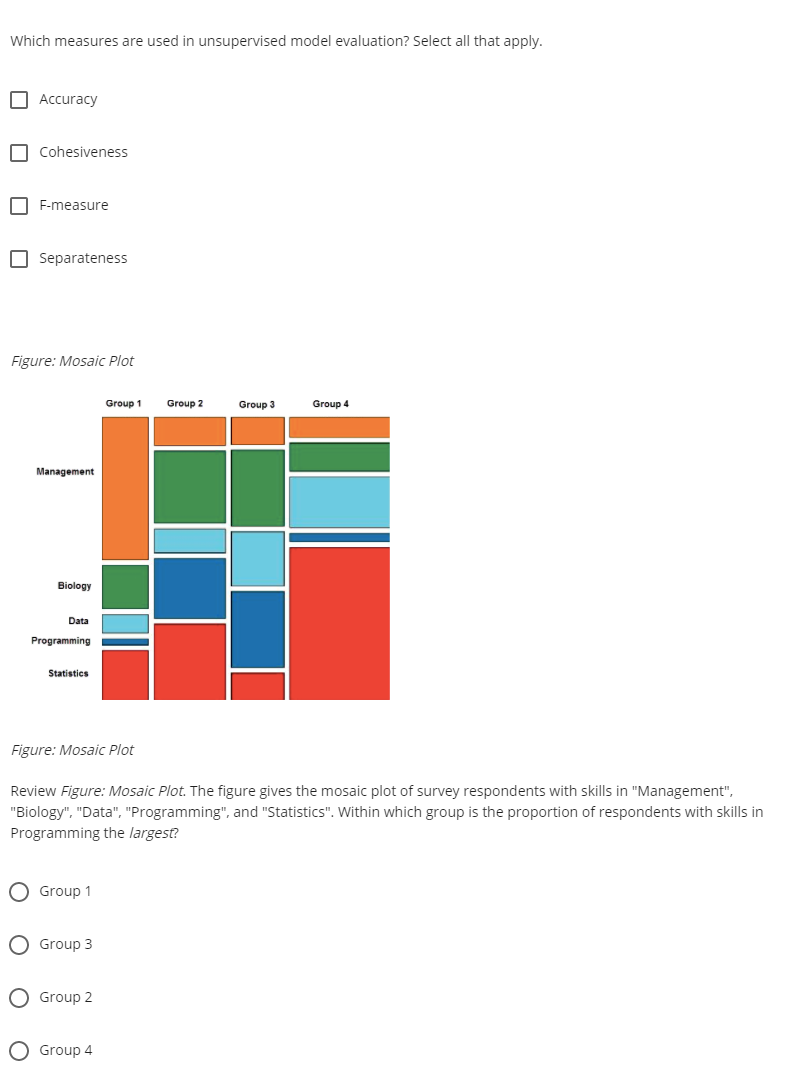
Figure: Tree Graph Node 1 Node 2 Node 3 Figure: Tree Graph Review Figure: Tree Graph. In the tree depicted in this figure, which node has the highest entropy? O Node 1 Node 2 Node 3 Which measures are used in unsupervised model evaluation? Select all that apply. Accuracy O Cohesiveness N F-measure O Separateness Figure: Mosaic Plot Group 1 Group 2 Group 3 Group 4 Management Biology Data Programming Statistics Figure: Mosaic Plot Review Figure: Mosaic Plot. The figure gives the mosaic plot of survey respondents with skills in "Management", "Biology", "Data", "Programming", and "Statistics". Within which group is the proportion of respondents with skills in Programming the largest? O Group 1 O Group 3 O Group 2 O Group 4
Step by Step Solution
There are 3 Steps involved in it

Get step-by-step solutions from verified subject matter experts