

Question: Figure-1 represents a plot of Ln(P) vs 1/T for Octane. Use this figure and the table given below to accomplish the following tasks. Part-1 Add
Figure-1 represents a plot of Ln(P) vs 1/T for Octane. Use this figure and the table given below to accomplish the following tasks.
Part-1
Add the straight lines of Butane and Hexane to Figure-1.
Part-2
Draw the three curves of vapor pressure vs temperature (C) for Butane, Hexane and Octane using one figure.
(Use Figure-2 as an example).
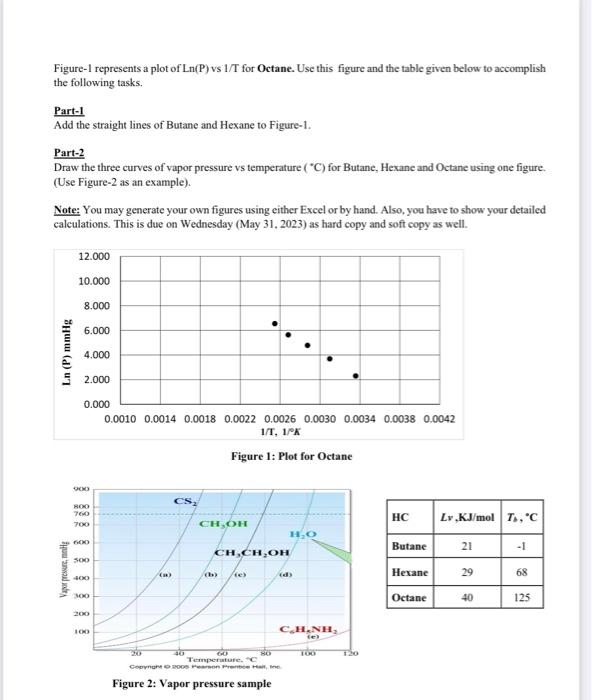
Figure-1 represents a plot of Ln(P) vs 1/T for O ctane. Use this figure and the table given below to accomplish the following tasks. Part-1 Add the straight lines of Butane and Hexane to Figure-1. Part-2 Draw the three curves of vapor pressure vs temperature (C) for Butane, Hexane and Octane using one figure. (Use Figure-2 as an example). Note: You may generate your own figures using either Excel or by hand. Also, you have to show your detailed calculations. This is due on Wednesday (May 31, 2023) as hard copy and soft copy as well. Figure 1: Plot for Octane
Step by Step Solution
There are 3 Steps involved in it

Get step-by-step solutions from verified subject matter experts