

Question: Figures C and D below are option payoff curves. One of the figures refers to a call, while the other refers to a put option.
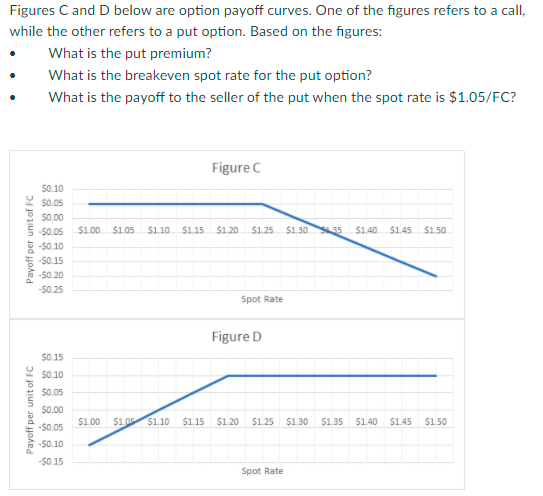
Figures C and D below are option payoff curves. One of the figures refers to a call, while the other refers to a put option. Based on the figures: What is the put premium? What is the breakeven spot rate for the put option? What is the payoff to the seller of the put when the spot rate is $1.05/FC? Figure $0.10 $0.05 $0.00 $ $0.05 $1.00 $1.05 $1.10 $1.15 $1.20 $1.25 $13035 $1.40 $1.45 $150 Payoff per unit of FC -50.10 -$0.15 -$0.20 -$0.25 Spot Rate Figure D $0.15 $0.10 $0.05 Payoff per unit of FC $0.00 $1.00 $1.00 $1.10 $1.15 $1 20 $1.25 $1.30 $1.35 $1.40 $1.45 -$0.05 $1.50 -50.10 -$0.15 Spot Rate Figures C and D below are option payoff curves. One of the figures refers to a call, while the other refers to a put option. Based on the figures: What is the put premium? What is the breakeven spot rate for the put option? What is the payoff to the seller of the put when the spot rate is $1.05/FC? Figure $0.10 $0.05 $0.00 $ $0.05 $1.00 $1.05 $1.10 $1.15 $1.20 $1.25 $13035 $1.40 $1.45 $150 Payoff per unit of FC -50.10 -$0.15 -$0.20 -$0.25 Spot Rate Figure D $0.15 $0.10 $0.05 Payoff per unit of FC $0.00 $1.00 $1.00 $1.10 $1.15 $1 20 $1.25 $1.30 $1.35 $1.40 $1.45 -$0.05 $1.50 -50.10 -$0.15 Spot Rate
Step by Step Solution
There are 3 Steps involved in it

Get step-by-step solutions from verified subject matter experts