

Question: File Edit Insert Table Organize Format Arrange View Share Window Help Untitled 2 - Edited DE . T Add Category Insert Table Chart Text D
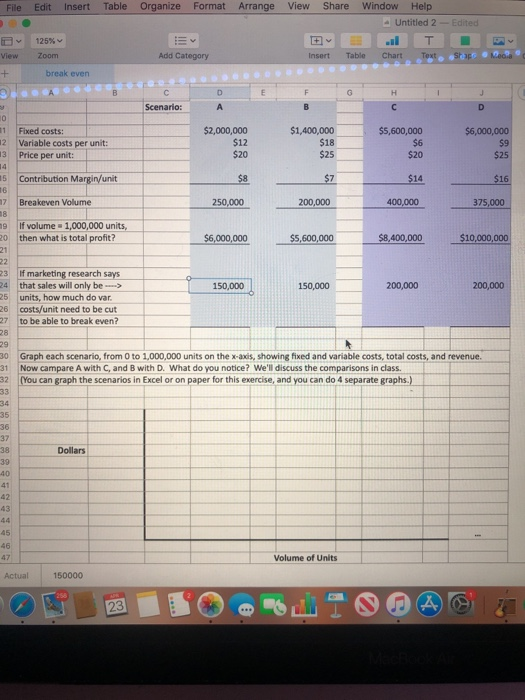
File Edit Insert Table Organize Format Arrange View Share Window Help Untitled 2 - Edited DE . T Add Category Insert Table Chart Text D View 125% Zoom Media + break even Scenario: $1,400,000 Fixed costs: Variable costs per unit: Price per unit: $2,000,000 $12 $5,600,000 $6 $6,000,000 $25 $20 $25 $20 15 Contribution Margin/unit $7 $16 $14 400,000 Breakeven Volume 250,000 200,000 375,000 mg 20 If volume - 1,000,000 units, then what is total profit? $6,000,000 $5,600,000 $8,400,000 $10,000,000 24 150,000 150,000 200,000 200,000 If marketing research says that sales will only be --> units, how much do var. costs/unit need to be cut to be able to break even? 27 Graph each scenario, from 0 to 1,000,000 units on the x-axis, showing fixed and variable costs, total costs, and revenue. 31 Now campare A with C, and B with D. What do you notice? We'll discuss the comparisons in class. (You can graph the scenarios in Excel or on paper for this exercise, and you can do 4 separate graphs.) Dollars Volume of Units Actual 150000
Step by Step Solution
There are 3 Steps involved in it

Get step-by-step solutions from verified subject matter experts