

Question: File Home Insert Draw Page Layout Formulas Data Review View Help Arial 10 a Wrap Text X Cut LB Copy * Format Painter - A
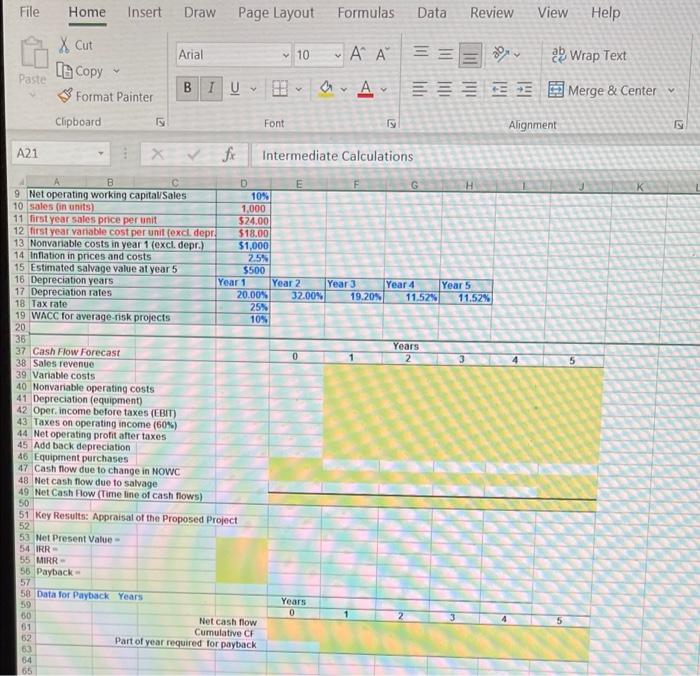
File Home Insert Draw Page Layout Formulas Data Review View Help Arial 10 a Wrap Text X Cut LB Copy * Format Painter - A AA == 0 = == = Paste B I U Merge & Center Clipboard Font ig Alignment 2 A21 X. f Intermediate Calculations 4 B D E F G 9 Net operating working capital/Sales 10% 10 sales in units) 1.000 11 first year sales price per unit $24.00 12 first year variable cost per unit excl. depr. $18.00 13 Nonvariable costs in year 1 (excl. depr.) $1,000 14 Inflation in prices and costs 2.5% 15 Estimated salvage value at year 5 $500 16 Depreciation years Year 1 Year 2 Year 3 Year 4 Year 5 17 Depreciation rates 20.00% 32.00% 19.20N 11.52% 11.52% 18 Tax rate 25% 19 WACC for average-risk projects 10% 20 36 Years 37 Cash Flow Forecast 0 2 38 Sales revenue 39 Variable costs 40 Nonvariable operating costs 41 Depreciation (equipment) 42 Oper income before taxes (EBIT) 43 Taxes on operating income (60%) 44 Net operating profit after taxes 45 Add back depreciation 46 Equipment purchases 47 Cash flow due to change in NOWC 48 Net cash flow due to salvage 49 Net Cash Flow (Time line of cash flows) 50 51 Key Results: Appraisal of the Proposed Project 52 53 Net Present Value 54 IRR 55 MIRR- 56 Payback 57 58 Data for Payback Years Years 59 0 50 Net cash flow 61 Cumulative CF 62 Part of year required for payback 63 64 65 File Home Insert Draw Page Layout Formulas Data Review View Help Arial 10 a Wrap Text X Cut LB Copy * Format Painter - A AA == 0 = == = Paste B I U Merge & Center Clipboard Font ig Alignment 2 A21 X. f Intermediate Calculations 4 B D E F G 9 Net operating working capital/Sales 10% 10 sales in units) 1.000 11 first year sales price per unit $24.00 12 first year variable cost per unit excl. depr. $18.00 13 Nonvariable costs in year 1 (excl. depr.) $1,000 14 Inflation in prices and costs 2.5% 15 Estimated salvage value at year 5 $500 16 Depreciation years Year 1 Year 2 Year 3 Year 4 Year 5 17 Depreciation rates 20.00% 32.00% 19.20N 11.52% 11.52% 18 Tax rate 25% 19 WACC for average-risk projects 10% 20 36 Years 37 Cash Flow Forecast 0 2 38 Sales revenue 39 Variable costs 40 Nonvariable operating costs 41 Depreciation (equipment) 42 Oper income before taxes (EBIT) 43 Taxes on operating income (60%) 44 Net operating profit after taxes 45 Add back depreciation 46 Equipment purchases 47 Cash flow due to change in NOWC 48 Net cash flow due to salvage 49 Net Cash Flow (Time line of cash flows) 50 51 Key Results: Appraisal of the Proposed Project 52 53 Net Present Value 54 IRR 55 MIRR- 56 Payback 57 58 Data for Payback Years Years 59 0 50 Net cash flow 61 Cumulative CF 62 Part of year required for payback 63 64 65
Step by Step Solution
There are 3 Steps involved in it

Get step-by-step solutions from verified subject matter experts