

Question: File Home Insert Draw Page Layout Formulas Data Review View Help Open in Desktop App Editing Share Comments bo M Calibri 11 B av ab
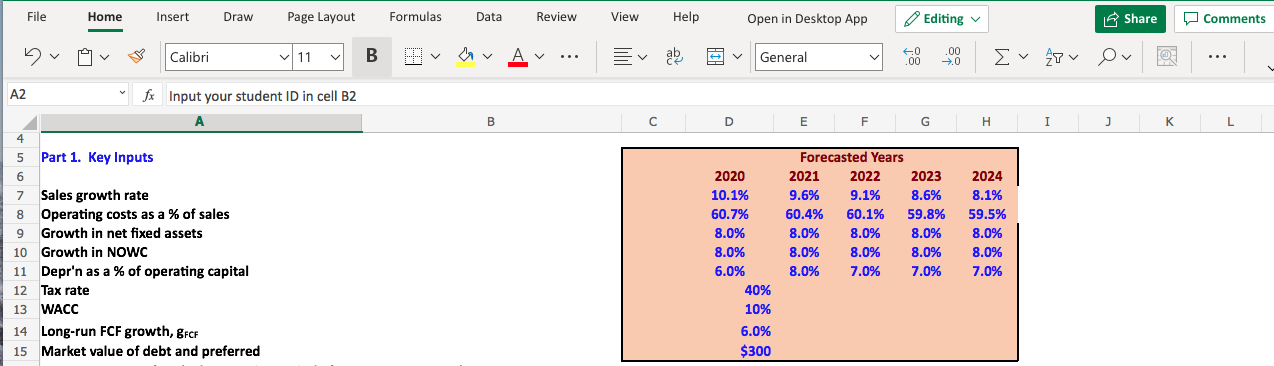
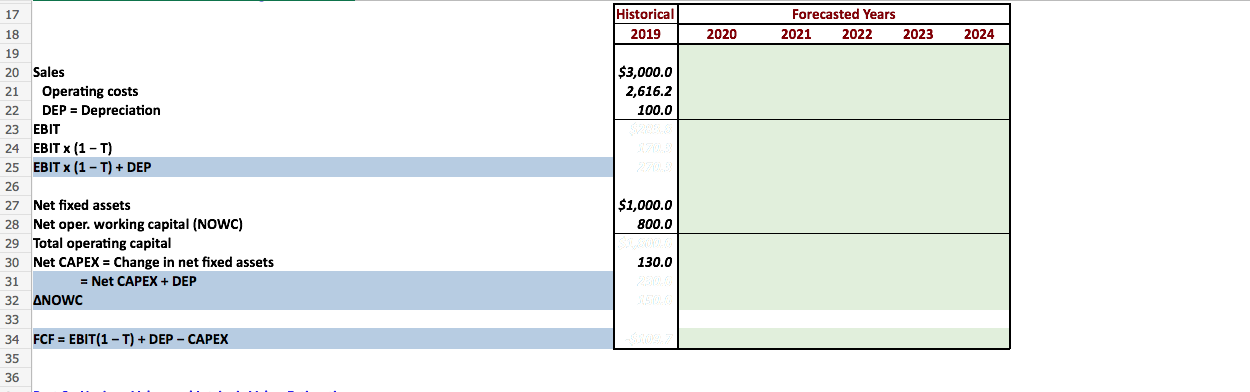
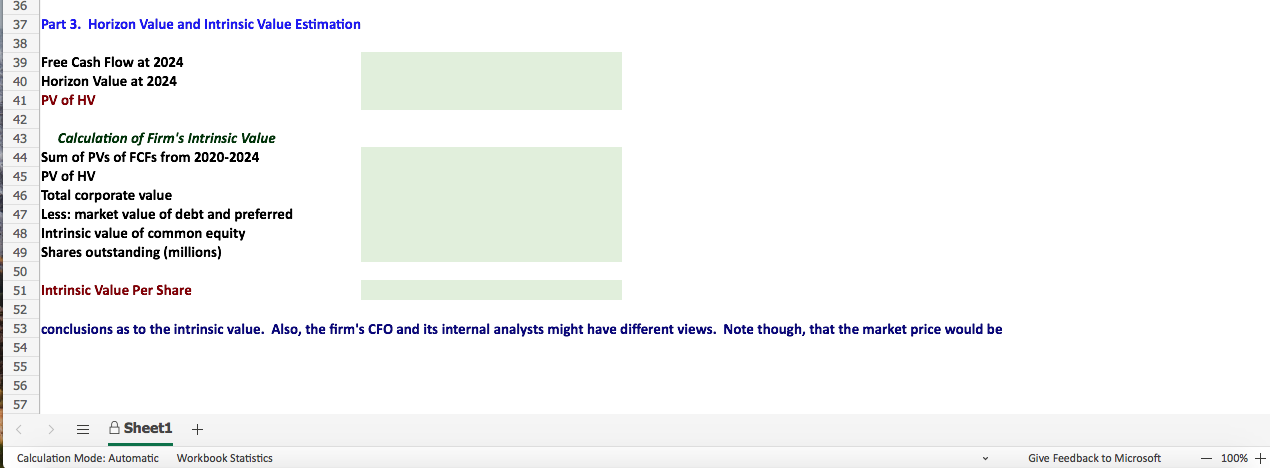
File Home Insert Draw Page Layout Formulas Data Review View Help Open in Desktop App Editing Share Comments bo M Calibri 11 B av ab General 60 .00 .00 0 Ev v Ov @ A2 fx Input your student ID in cell B2 A B D E F G H I J K L 4 5 Part 1. Key Inputs Forecasted Years 6 2020 2021 2022 2023 2024 10.1% 9.1% 8.6% 9.6% 60.4% 8.1% 59.5% 60.7% 60.1% 59.8% 8.0% 8.0% 8.0% 8.0% 8.0% 7 Sales growth rate 8 Operating costs as a % of sales 9 Growth in net fixed assets 10 Growth in NOWC 11 Depr'n as a % of operating capital 12 Tax rate 8.0% 8.0% 8.0% 8.0% 8.0% 6.0% 8.0% 7.0% 7.0% 7.0% 40% 13 WACC 10% 6.0% 14 Long-run FCF growth, &FCF 15 Market value of debt and preferred $300 17 Historical Forecasted Years 18 2019 2020 2021 2022 2023 2024 19 $3,000.0 2,616.2 100.0 20 Sales 21 Operating costs 22 DEP = Depreciation 23 EBIT 24 EBIT x (1 - T) 25 EBIT (1 - T) + DEP 26 27 Net fixed assets 28 Net oper. working capital (NOWC) 29 Total operating capital 30 Net CAPEX = Change in net fixed assets 31 = Net CAPEX + DEP $1,000.0 800.0 130.0 32 ANOWC 33 34 FCF = EBIT(1 - T) + DEP - CAPEX 35 36 36 37 Part 3. Horizon Value and Intrinsic Value Estimation 38 39 Free Cash Flow at 2024 40 Horizon Value at 2024 41 PV of HV 42 43 Calculation of Firm's Intrinsic Value 44 Sum of PVs of FCFs from 2020-2024 45 PV of HV 46 Total corporate value 47 Less: market value of debt and preferred 48 Intrinsic value of common equity 49 Shares outstanding (millions) 50 51 Intrinsic Value Per Share 52 53 conclusions as to the intrinsic value. Also, the firm's CFO and its internal analysts might have different views. Note though, that the market price would be 54 55 56 57 = Sheet1 + Calculation Mode: Automatic Workbook Statistics Give Feedback to Microsoft - 100% + File Home Insert Draw Page Layout Formulas Data Review View Help Open in Desktop App Editing Share Comments bo M Calibri 11 B av ab General 60 .00 .00 0 Ev v Ov @ A2 fx Input your student ID in cell B2 A B D E F G H I J K L 4 5 Part 1. Key Inputs Forecasted Years 6 2020 2021 2022 2023 2024 10.1% 9.1% 8.6% 9.6% 60.4% 8.1% 59.5% 60.7% 60.1% 59.8% 8.0% 8.0% 8.0% 8.0% 8.0% 7 Sales growth rate 8 Operating costs as a % of sales 9 Growth in net fixed assets 10 Growth in NOWC 11 Depr'n as a % of operating capital 12 Tax rate 8.0% 8.0% 8.0% 8.0% 8.0% 6.0% 8.0% 7.0% 7.0% 7.0% 40% 13 WACC 10% 6.0% 14 Long-run FCF growth, &FCF 15 Market value of debt and preferred $300 17 Historical Forecasted Years 18 2019 2020 2021 2022 2023 2024 19 $3,000.0 2,616.2 100.0 20 Sales 21 Operating costs 22 DEP = Depreciation 23 EBIT 24 EBIT x (1 - T) 25 EBIT (1 - T) + DEP 26 27 Net fixed assets 28 Net oper. working capital (NOWC) 29 Total operating capital 30 Net CAPEX = Change in net fixed assets 31 = Net CAPEX + DEP $1,000.0 800.0 130.0 32 ANOWC 33 34 FCF = EBIT(1 - T) + DEP - CAPEX 35 36 36 37 Part 3. Horizon Value and Intrinsic Value Estimation 38 39 Free Cash Flow at 2024 40 Horizon Value at 2024 41 PV of HV 42 43 Calculation of Firm's Intrinsic Value 44 Sum of PVs of FCFs from 2020-2024 45 PV of HV 46 Total corporate value 47 Less: market value of debt and preferred 48 Intrinsic value of common equity 49 Shares outstanding (millions) 50 51 Intrinsic Value Per Share 52 53 conclusions as to the intrinsic value. Also, the firm's CFO and its internal analysts might have different views. Note though, that the market price would be 54 55 56 57 = Sheet1 + Calculation Mode: Automatic Workbook Statistics Give Feedback to Microsoft - 100% +
Step by Step Solution
There are 3 Steps involved in it

Get step-by-step solutions from verified subject matter experts