

Question: File Home Insert Draw Page Layout Formulas Data Review View Help Comments Share MS Sans Serif AutoSum 10 ~ A == ale Wrap Text General
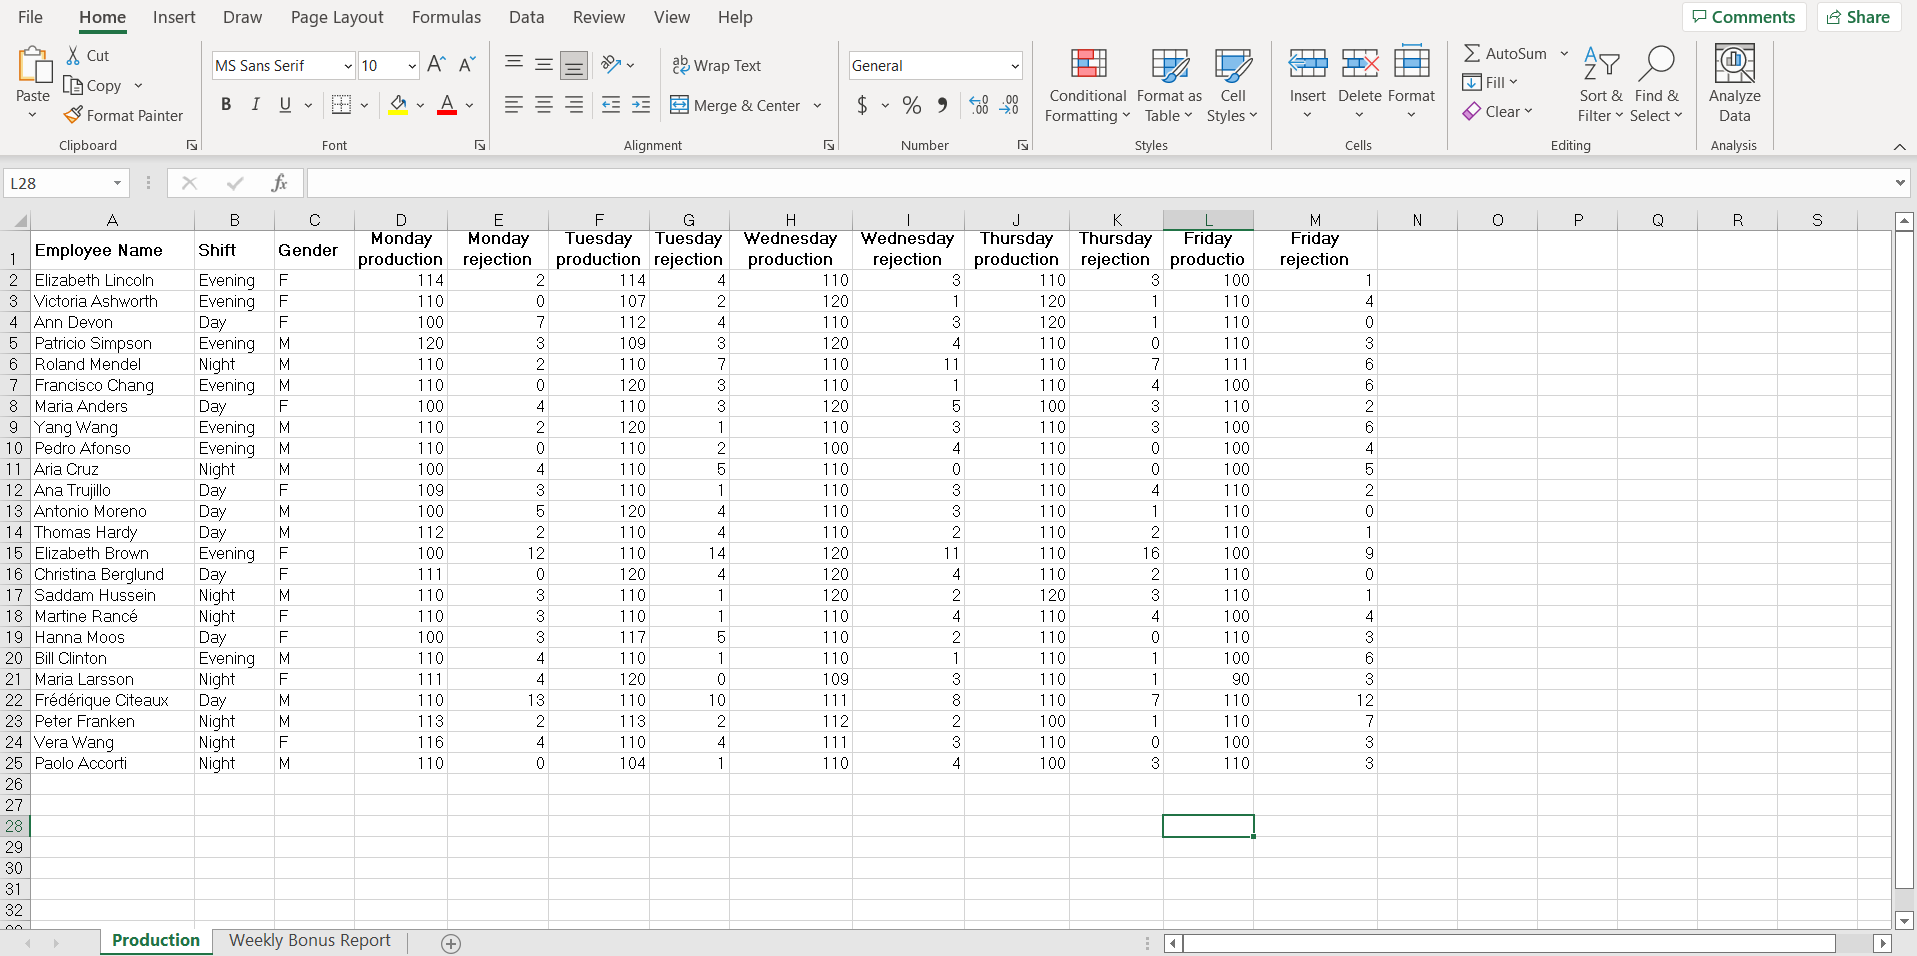
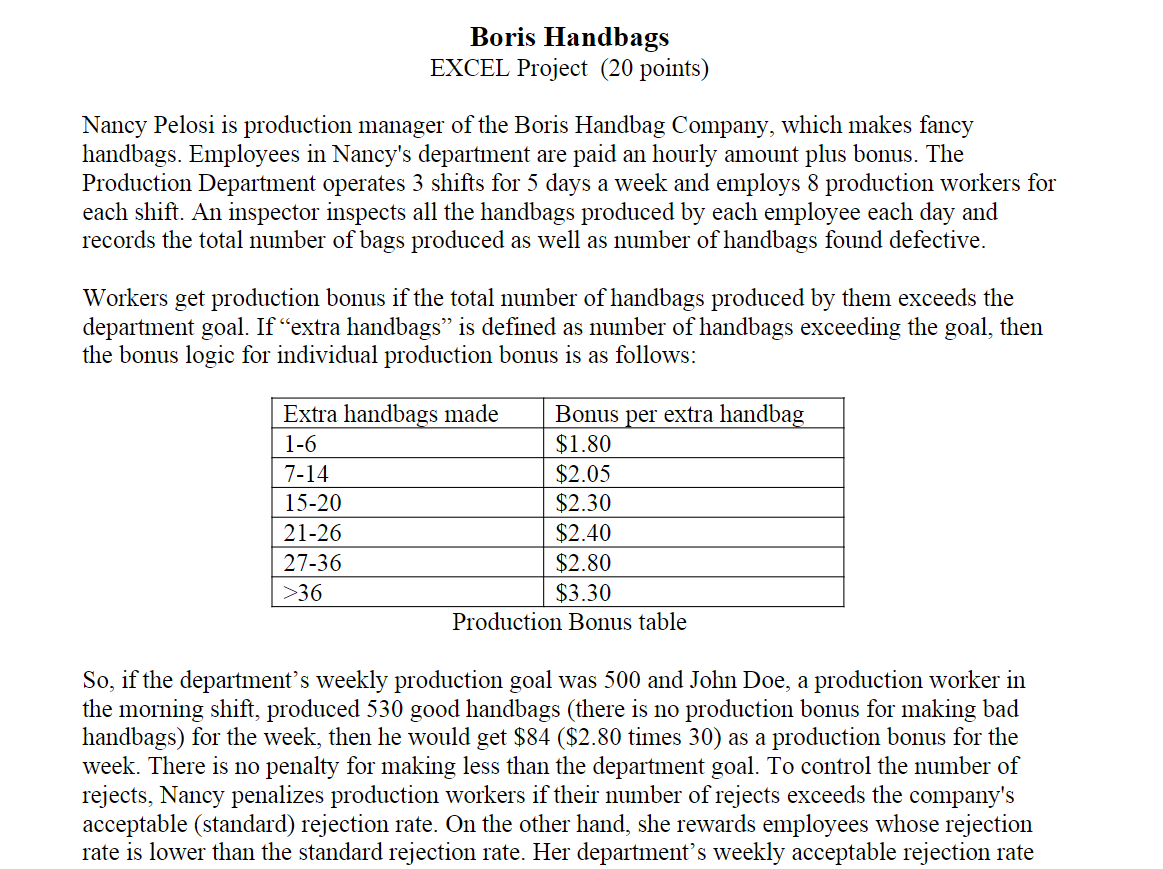
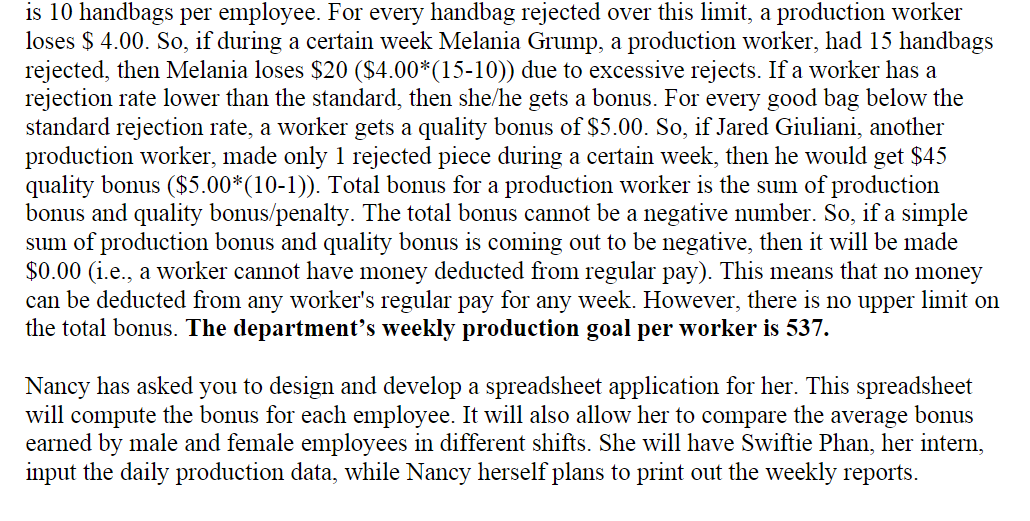

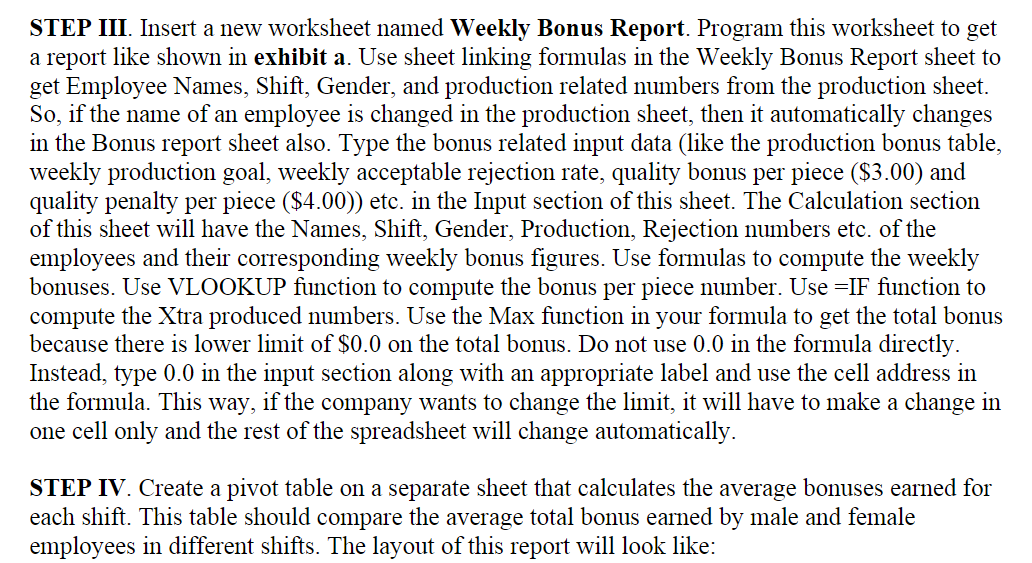
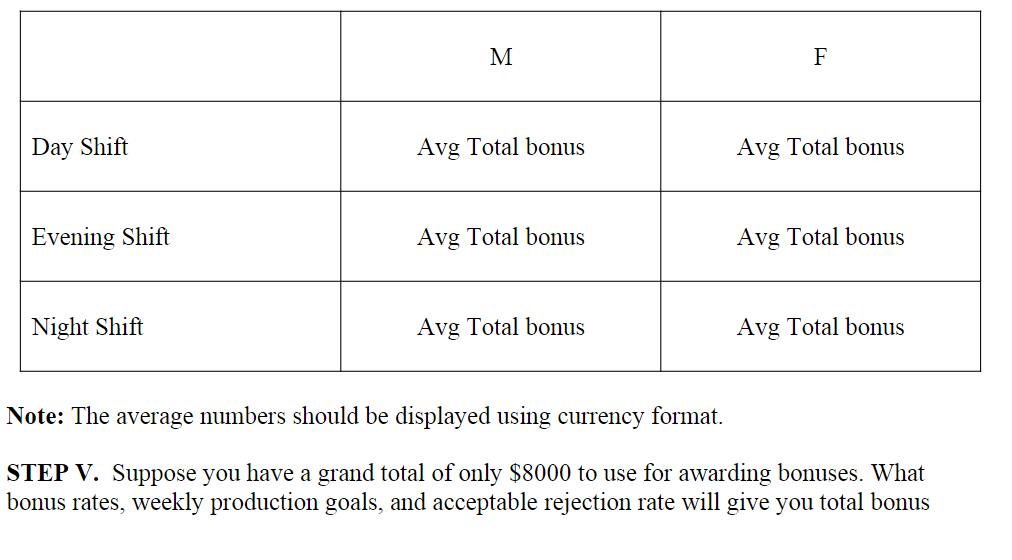
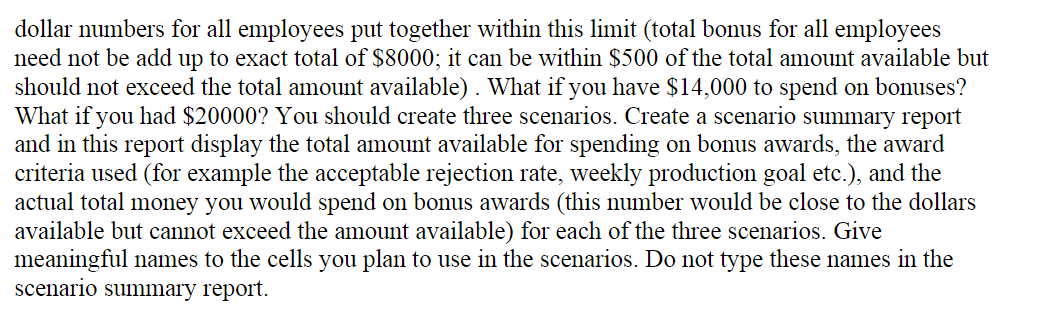
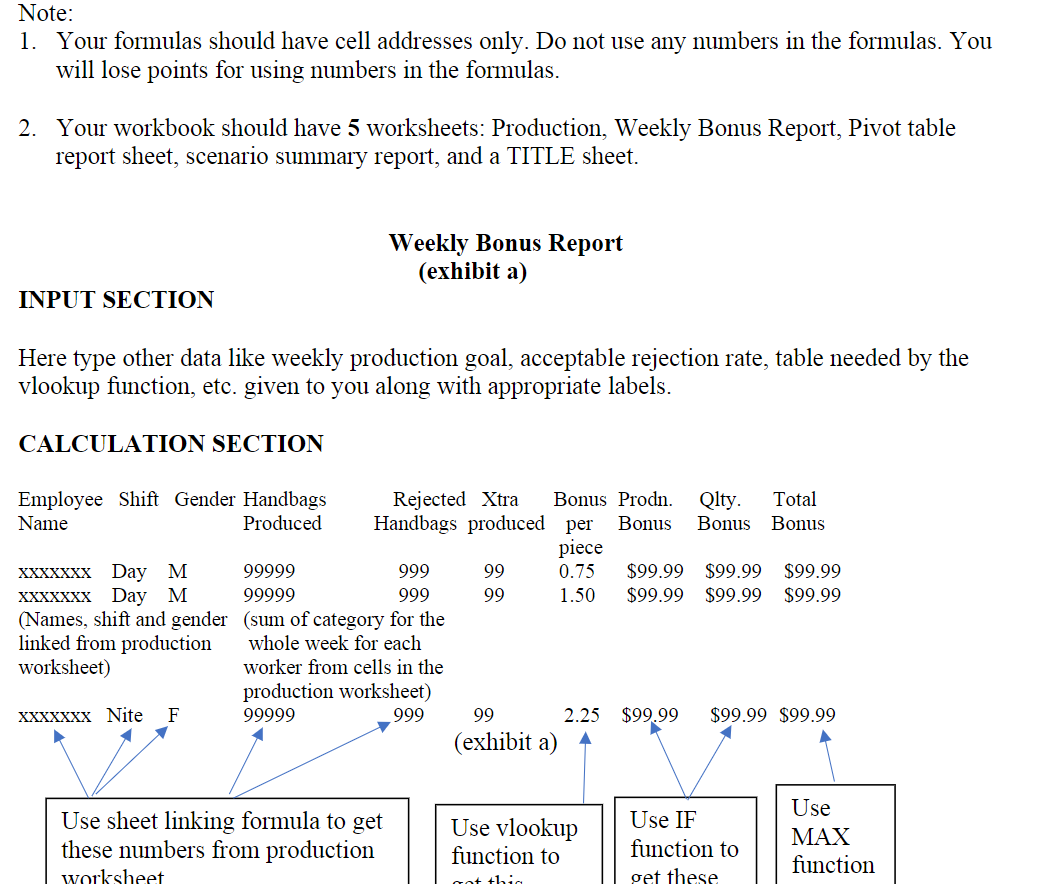
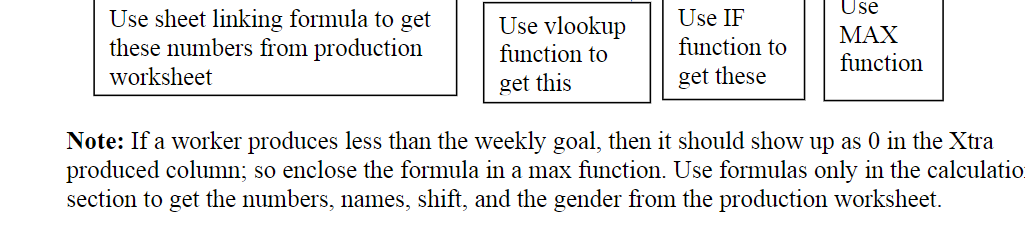
File Home Insert Draw Page Layout Formulas Data Review View Help Comments Share MS Sans Serif AutoSum 10 ~ A == ale Wrap Text General AT TT 28 X Cut LO Copy Format Painter Fill Paste BI U Insert Delete Format Merge & Center $ - % - Conditional Format as Cell Formatting Table Styles Clear Sort & Find & Filter Select Analyze Data Clipboard Font Alignment Number Styles Cells Editing Analysis L28 x fx N 0 Q R 0) M Friday rejection | Wednesday rejection 3 1 3 4 11 1 1 4 0 3 6 6 2 Day 3 4 6 4 5 110 2 0 3 3 2 11 NANAN WOWO A B C D E F G H Monday Monday Tuesday Tuesday Wednesday Gender Shift Employee Name 1 production rejection production rejection production 2 Elizabeth Lincoln Evening F 114 114 4 110 3 Victoria Ashworth Evening F 110 0 107 2 120 4 Ann Devon Day F. 100 7 112 4 110 5 Patricio Simpson Evening M 120 3 109 3 120 6 Roland Mendel Night M 110 2 110 7 110 7 Francisco Chang Evening M 110 0 120 3 110 8 Maria Anders F 100 4 110 3 120 9 Yang Wang Evening M 110 2 120 1 110 10 Pedro Afonso Evening M 110 0 110 2 100 11 Aria Cruz Night M 100 4 5 110 12 Ana Trujillo Day F 109 3 110 1 110 13 Antonio Moreno Day M 100 5 120 4 110 14 Thomas Hardy Day M 112 2 110 4 110 15 Elizabeth Brown Evening F 100 12 110 14 120 16 Christina Berglund Day F 111 0 120 4 120 17 Saddam Hussein Night M 110 3 110 1 120 18 Martine Ranc Night F 110 3 110 1 110 19 Hanna Moos Day F. 100 5 110 20 Bill Clinton Evening M 110 4 110 1 110 21 Maria Larsson Night F 111 120 0 109 22 Frdrique Citeaux Day M 110 110 10 111 23 Peter Franken Night M 113 113 2 112 24 Vera Wang Night F 116 110 4. 111 25 Paolo Accorti Night M 110 104 1 110 26 27 28 29 30 31 32 Production Weekly Bonus Report . Thursday Thursday Friday production rejection productio 110 3 100 120 1 110 120 1 110 110 0 110 110 7 111 110 4 100 100 3 110 110 3 100 110 0 100 110 0 100 110 4 110 110 1 110 2 110 110 16 100 110 2 110 120 3 110 110 4 100 110 0 110 110 1 100 110 1 90 110 7 110 100 1 110 110 0 100 100 3 110 110 2 4 2 1 0 1 9 0 1 4 3 6 3 12 117 OANA WWW 8 7 ACN 00 2 3 3 3 Boris Handbags EXCEL Project (20 points) Nancy Pelosi is production manager of the Boris Handbag Company, which makes fancy handbags. Employees in Nancy's department are paid an hourly amount plus bonus. The Production Department operates 3 shifts for 5 days a week and employs 8 production workers for each shift. An inspector inspects all the handbags produced by each employee each day and records the total number of bags produced as well as number of handbags found defective. Workers get production bonus if the total number of handbags produced by them exceeds the department goal. If extra handbags is defined as number of handbags exceeding the goal, then the bonus logic for individual production bonus is as follows: Extra handbags made Bonus per extra handbag 1-6 $1.80 7-14 $2.05 15-20 $2.30 21-26 $2.40 27-36 $2.80 >36 $3.30 Production Bonus table So, if the department's weekly production goal was 500 and John Doe, a production worker in the morning shift, produced 530 good handbags (there is no production bonus for making bad handbags) for the week, then he would get $84 ($2.80 times 30) as a production bonus for the week. There is no penalty for making less than the department goal. To control the number of rejects, Nancy penalizes production workers if their number of rejects exceeds the company's acceptable (standard) rejection rate. On the other hand, she rewards employees whose rejection rate is lower than the standard rejection rate. Her department's weekly acceptable rejection rate is 10 handbags per employee. For every handbag rejected over this limit, a production worker loses $ 4.00. So, if during a certain week Melania Grump, a production worker, had 15 handbags rejected, then Melania loses $20 ($4.00*(15-10)) due to excessive rejects. If a worker has a rejection rate lower than the standard, then she/he gets a bonus. For every good bag below the standard rejection rate, a worker gets a quality bonus of $5.00. So, if Jared Giuliani, another production worker, made only 1 rejected piece during a certain week, then he would get $45 quality bonus ($5.00*(10-1)). Total bonus for a production worker is the sum of production bonus and quality bonus/penalty. The total bonus cannot be a negative number. So, if a simple sum of production bonus and quality bonus is coming out to be negative, then it will be made $0.00 (i.e., a worker cannot have money deducted from regular pay). This means that no money can be deducted from any worker's regular pay for any week. However, there is no upper limit on the total bonus. The department's weekly production goal per worker is 537. Nancy has asked you to design and develop a spreadsheet application for her. This spreadsheet will compute the bonus for each employee. It will also allow her to compare the average bonus earned by male and female employees in different shifts. She will have Swiftie Phan, her intern, input the daily production data, while Nancy herself plans to print out the weekly reports. STEP II. Add a TITLE sheet to your spreadsheet to make it as self-documenting as possible. Include a paragraph for purpose. In this paragraph describe what information a user can get from this spreadsheet/workbook. STEP III. Insert a new worksheet named Weekly Bonus Report. Program this worksheet to get a report like shown in exhibit a. Use sheet linking formulas in the Weekly Bonus Report sheet to get Employee Names, Shift, Gender, and production related numbers from the production sheet. So, if the name of an employee is changed in the production sheet, then it automatically changes in the Bonus report sheet also. Type the bonus related input data (like the production bonus table, weekly production goal, weekly acceptable rejection rate, quality bonus per piece ($3.00) and quality penalty per piece ($4.00)) etc. in the Input section of this sheet. The Calculation section of this sheet will have the Names, Shift, Gender, Production, Rejection numbers etc. of the employees and their corresponding weekly bonus figures. Use formulas to compute the weekly bonuses. Use VLOOKUP function to compute the bonus per piece number. Use =IF function to compute the Xtra produced numbers. Use the Max function in your formula to get the total bonus because there is lower limit of $0.0 on the total bonus. Do not use 0.0 in the formula directly. Instead, type 0.0 in the input section along with an appropriate label and use the cell address in the formula. This way, if the company wants to change the limit, it will have to make a change in one cell only and the rest of the spreadsheet will change automatically. STEP IV. Create a pivot table on a separate sheet that calculates the average bonuses earned for each shift. This table should compare the average total bonus earned by male and female employees in different shifts. The layout of this report will look like: M F Day Shift Avg Total bonus Avg Total bonus Evening Shift Avg Total bonus Avg Total bonus Night Shift Avg Total bonus Avg Total bonus Note: The average numbers should be displayed using currency format. STEP V. Suppose you have a grand total of only $8000 to use for awarding bonuses. What bonus rates, weekly production goals, and acceptable rejection rate will give you total bonus dollar numbers for all employees put together within this limit (total bonus for all employees need not be add up to exact total of $8000; it can be within $500 of the total amount available but should not exceed the total amount available). What if you have $14,000 to spend on bonuses? What if you had $20000? You should create three scenarios. Create a scenario summary report and in this report display the total amount available for spending on bonus awards, the award criteria used (for example the acceptable rejection rate, weekly production goal etc.), and the actual total money you would spend on bonus awards (this number would be close to the dollars available but cannot exceed the amount available) for each of the three scenarios. Give meaningful names to the cells you plan to use in the scenarios. Do not type these names in the scenario summary report. Note: 1. Your formulas should have cell addresses only. Do not use any numbers in the formulas. You will lose points for using numbers in the formulas. 2. Your workbook should have 5 worksheets: Production, Weekly Bonus Report, Pivot table report sheet, scenario summary report, and a TITLE sheet. Weekly Bonus Report (exhibit a) INPUT SECTION Here type other data like weekly production goal, acceptable rejection rate, table needed by the vlookup function, etc. given to you along with appropriate labels. CALCULATION SECTION Employee Shift Gender Handbags Rejected Xtra Bonus Prodn. Qlty. Total Name Produced Handbags produced per Bonus Bonus Bonus piece XXxxxxx Day M 99999 999 99 0.75 $99.99 $99.99 $99.99 XXXXXXX Day M 99999 999 99 1.50 $99.99 $99.99 $99.99 (Names, shift and gender (sum of category for the linked from production whole week for each worksheet) worker from cells in the production worksheet) XXXXXXX Nite F 99999 999 99 2.25 $99.99 $99.99 $99.99 (exhibit a) A Use sheet linking formula to get these numbers from production worksheet Use vlookup function to Use IF function to get these Use MAX function Got this Use sheet linking formula to get these numbers from production worksheet Use vlookup function to Use IF function to Use MAX function get this get these Note: If a worker produces less than the weekly goal, then it should show up as in the Xtra produced column; so enclose the formula in a max function. Use formulas only in the calculatio section to get the numbers, names, shift, and the gender from the production worksheet. File Home Insert Draw Page Layout Formulas Data Review View Help Comments Share MS Sans Serif AutoSum 10 ~ A == ale Wrap Text General AT TT 28 X Cut LO Copy Format Painter Fill Paste BI U Insert Delete Format Merge & Center $ - % - Conditional Format as Cell Formatting Table Styles Clear Sort & Find & Filter Select Analyze Data Clipboard Font Alignment Number Styles Cells Editing Analysis L28 x fx N 0 Q R 0) M Friday rejection | Wednesday rejection 3 1 3 4 11 1 1 4 0 3 6 6 2 Day 3 4 6 4 5 110 2 0 3 3 2 11 NANAN WOWO A B C D E F G H Monday Monday Tuesday Tuesday Wednesday Gender Shift Employee Name 1 production rejection production rejection production 2 Elizabeth Lincoln Evening F 114 114 4 110 3 Victoria Ashworth Evening F 110 0 107 2 120 4 Ann Devon Day F. 100 7 112 4 110 5 Patricio Simpson Evening M 120 3 109 3 120 6 Roland Mendel Night M 110 2 110 7 110 7 Francisco Chang Evening M 110 0 120 3 110 8 Maria Anders F 100 4 110 3 120 9 Yang Wang Evening M 110 2 120 1 110 10 Pedro Afonso Evening M 110 0 110 2 100 11 Aria Cruz Night M 100 4 5 110 12 Ana Trujillo Day F 109 3 110 1 110 13 Antonio Moreno Day M 100 5 120 4 110 14 Thomas Hardy Day M 112 2 110 4 110 15 Elizabeth Brown Evening F 100 12 110 14 120 16 Christina Berglund Day F 111 0 120 4 120 17 Saddam Hussein Night M 110 3 110 1 120 18 Martine Ranc Night F 110 3 110 1 110 19 Hanna Moos Day F. 100 5 110 20 Bill Clinton Evening M 110 4 110 1 110 21 Maria Larsson Night F 111 120 0 109 22 Frdrique Citeaux Day M 110 110 10 111 23 Peter Franken Night M 113 113 2 112 24 Vera Wang Night F 116 110 4. 111 25 Paolo Accorti Night M 110 104 1 110 26 27 28 29 30 31 32 Production Weekly Bonus Report . Thursday Thursday Friday production rejection productio 110 3 100 120 1 110 120 1 110 110 0 110 110 7 111 110 4 100 100 3 110 110 3 100 110 0 100 110 0 100 110 4 110 110 1 110 2 110 110 16 100 110 2 110 120 3 110 110 4 100 110 0 110 110 1 100 110 1 90 110 7 110 100 1 110 110 0 100 100 3 110 110 2 4 2 1 0 1 9 0 1 4 3 6 3 12 117 OANA WWW 8 7 ACN 00 2 3 3 3 Boris Handbags EXCEL Project (20 points) Nancy Pelosi is production manager of the Boris Handbag Company, which makes fancy handbags. Employees in Nancy's department are paid an hourly amount plus bonus. The Production Department operates 3 shifts for 5 days a week and employs 8 production workers for each shift. An inspector inspects all the handbags produced by each employee each day and records the total number of bags produced as well as number of handbags found defective. Workers get production bonus if the total number of handbags produced by them exceeds the department goal. If extra handbags is defined as number of handbags exceeding the goal, then the bonus logic for individual production bonus is as follows: Extra handbags made Bonus per extra handbag 1-6 $1.80 7-14 $2.05 15-20 $2.30 21-26 $2.40 27-36 $2.80 >36 $3.30 Production Bonus table So, if the department's weekly production goal was 500 and John Doe, a production worker in the morning shift, produced 530 good handbags (there is no production bonus for making bad handbags) for the week, then he would get $84 ($2.80 times 30) as a production bonus for the week. There is no penalty for making less than the department goal. To control the number of rejects, Nancy penalizes production workers if their number of rejects exceeds the company's acceptable (standard) rejection rate. On the other hand, she rewards employees whose rejection rate is lower than the standard rejection rate. Her department's weekly acceptable rejection rate is 10 handbags per employee. For every handbag rejected over this limit, a production worker loses $ 4.00. So, if during a certain week Melania Grump, a production worker, had 15 handbags rejected, then Melania loses $20 ($4.00*(15-10)) due to excessive rejects. If a worker has a rejection rate lower than the standard, then she/he gets a bonus. For every good bag below the standard rejection rate, a worker gets a quality bonus of $5.00. So, if Jared Giuliani, another production worker, made only 1 rejected piece during a certain week, then he would get $45 quality bonus ($5.00*(10-1)). Total bonus for a production worker is the sum of production bonus and quality bonus/penalty. The total bonus cannot be a negative number. So, if a simple sum of production bonus and quality bonus is coming out to be negative, then it will be made $0.00 (i.e., a worker cannot have money deducted from regular pay). This means that no money can be deducted from any worker's regular pay for any week. However, there is no upper limit on the total bonus. The department's weekly production goal per worker is 537. Nancy has asked you to design and develop a spreadsheet application for her. This spreadsheet will compute the bonus for each employee. It will also allow her to compare the average bonus earned by male and female employees in different shifts. She will have Swiftie Phan, her intern, input the daily production data, while Nancy herself plans to print out the weekly reports. STEP II. Add a TITLE sheet to your spreadsheet to make it as self-documenting as possible. Include a paragraph for purpose. In this paragraph describe what information a user can get from this spreadsheet/workbook. STEP III. Insert a new worksheet named Weekly Bonus Report. Program this worksheet to get a report like shown in exhibit a. Use sheet linking formulas in the Weekly Bonus Report sheet to get Employee Names, Shift, Gender, and production related numbers from the production sheet. So, if the name of an employee is changed in the production sheet, then it automatically changes in the Bonus report sheet also. Type the bonus related input data (like the production bonus table, weekly production goal, weekly acceptable rejection rate, quality bonus per piece ($3.00) and quality penalty per piece ($4.00)) etc. in the Input section of this sheet. The Calculation section of this sheet will have the Names, Shift, Gender, Production, Rejection numbers etc. of the employees and their corresponding weekly bonus figures. Use formulas to compute the weekly bonuses. Use VLOOKUP function to compute the bonus per piece number. Use =IF function to compute the Xtra produced numbers. Use the Max function in your formula to get the total bonus because there is lower limit of $0.0 on the total bonus. Do not use 0.0 in the formula directly. Instead, type 0.0 in the input section along with an appropriate label and use the cell address in the formula. This way, if the company wants to change the limit, it will have to make a change in one cell only and the rest of the spreadsheet will change automatically. STEP IV. Create a pivot table on a separate sheet that calculates the average bonuses earned for each shift. This table should compare the average total bonus earned by male and female employees in different shifts. The layout of this report will look like: M F Day Shift Avg Total bonus Avg Total bonus Evening Shift Avg Total bonus Avg Total bonus Night Shift Avg Total bonus Avg Total bonus Note: The average numbers should be displayed using currency format. STEP V. Suppose you have a grand total of only $8000 to use for awarding bonuses. What bonus rates, weekly production goals, and acceptable rejection rate will give you total bonus dollar numbers for all employees put together within this limit (total bonus for all employees need not be add up to exact total of $8000; it can be within $500 of the total amount available but should not exceed the total amount available). What if you have $14,000 to spend on bonuses? What if you had $20000? You should create three scenarios. Create a scenario summary report and in this report display the total amount available for spending on bonus awards, the award criteria used (for example the acceptable rejection rate, weekly production goal etc.), and the actual total money you would spend on bonus awards (this number would be close to the dollars available but cannot exceed the amount available) for each of the three scenarios. Give meaningful names to the cells you plan to use in the scenarios. Do not type these names in the scenario summary report. Note: 1. Your formulas should have cell addresses only. Do not use any numbers in the formulas. You will lose points for using numbers in the formulas. 2. Your workbook should have 5 worksheets: Production, Weekly Bonus Report, Pivot table report sheet, scenario summary report, and a TITLE sheet. Weekly Bonus Report (exhibit a) INPUT SECTION Here type other data like weekly production goal, acceptable rejection rate, table needed by the vlookup function, etc. given to you along with appropriate labels. CALCULATION SECTION Employee Shift Gender Handbags Rejected Xtra Bonus Prodn. Qlty. Total Name Produced Handbags produced per Bonus Bonus Bonus piece XXxxxxx Day M 99999 999 99 0.75 $99.99 $99.99 $99.99 XXXXXXX Day M 99999 999 99 1.50 $99.99 $99.99 $99.99 (Names, shift and gender (sum of category for the linked from production whole week for each worksheet) worker from cells in the production worksheet) XXXXXXX Nite F 99999 999 99 2.25 $99.99 $99.99 $99.99 (exhibit a) A Use sheet linking formula to get these numbers from production worksheet Use vlookup function to Use IF function to get these Use MAX function Got this Use sheet linking formula to get these numbers from production worksheet Use vlookup function to Use IF function to Use MAX function get this get these Note: If a worker produces less than the weekly goal, then it should show up as in the Xtra produced column; so enclose the formula in a max function. Use formulas only in the calculatio section to get the numbers, names, shift, and the gender from the production worksheet
Step by Step Solution
There are 3 Steps involved in it

Get step-by-step solutions from verified subject matter experts