

Question: File Home Insert Draw Page Layout Formulas Data Review View Help Question 20 Colors 0.5 pts Width: Automatic Gridlines H A Fonts Themes Margins Orientation
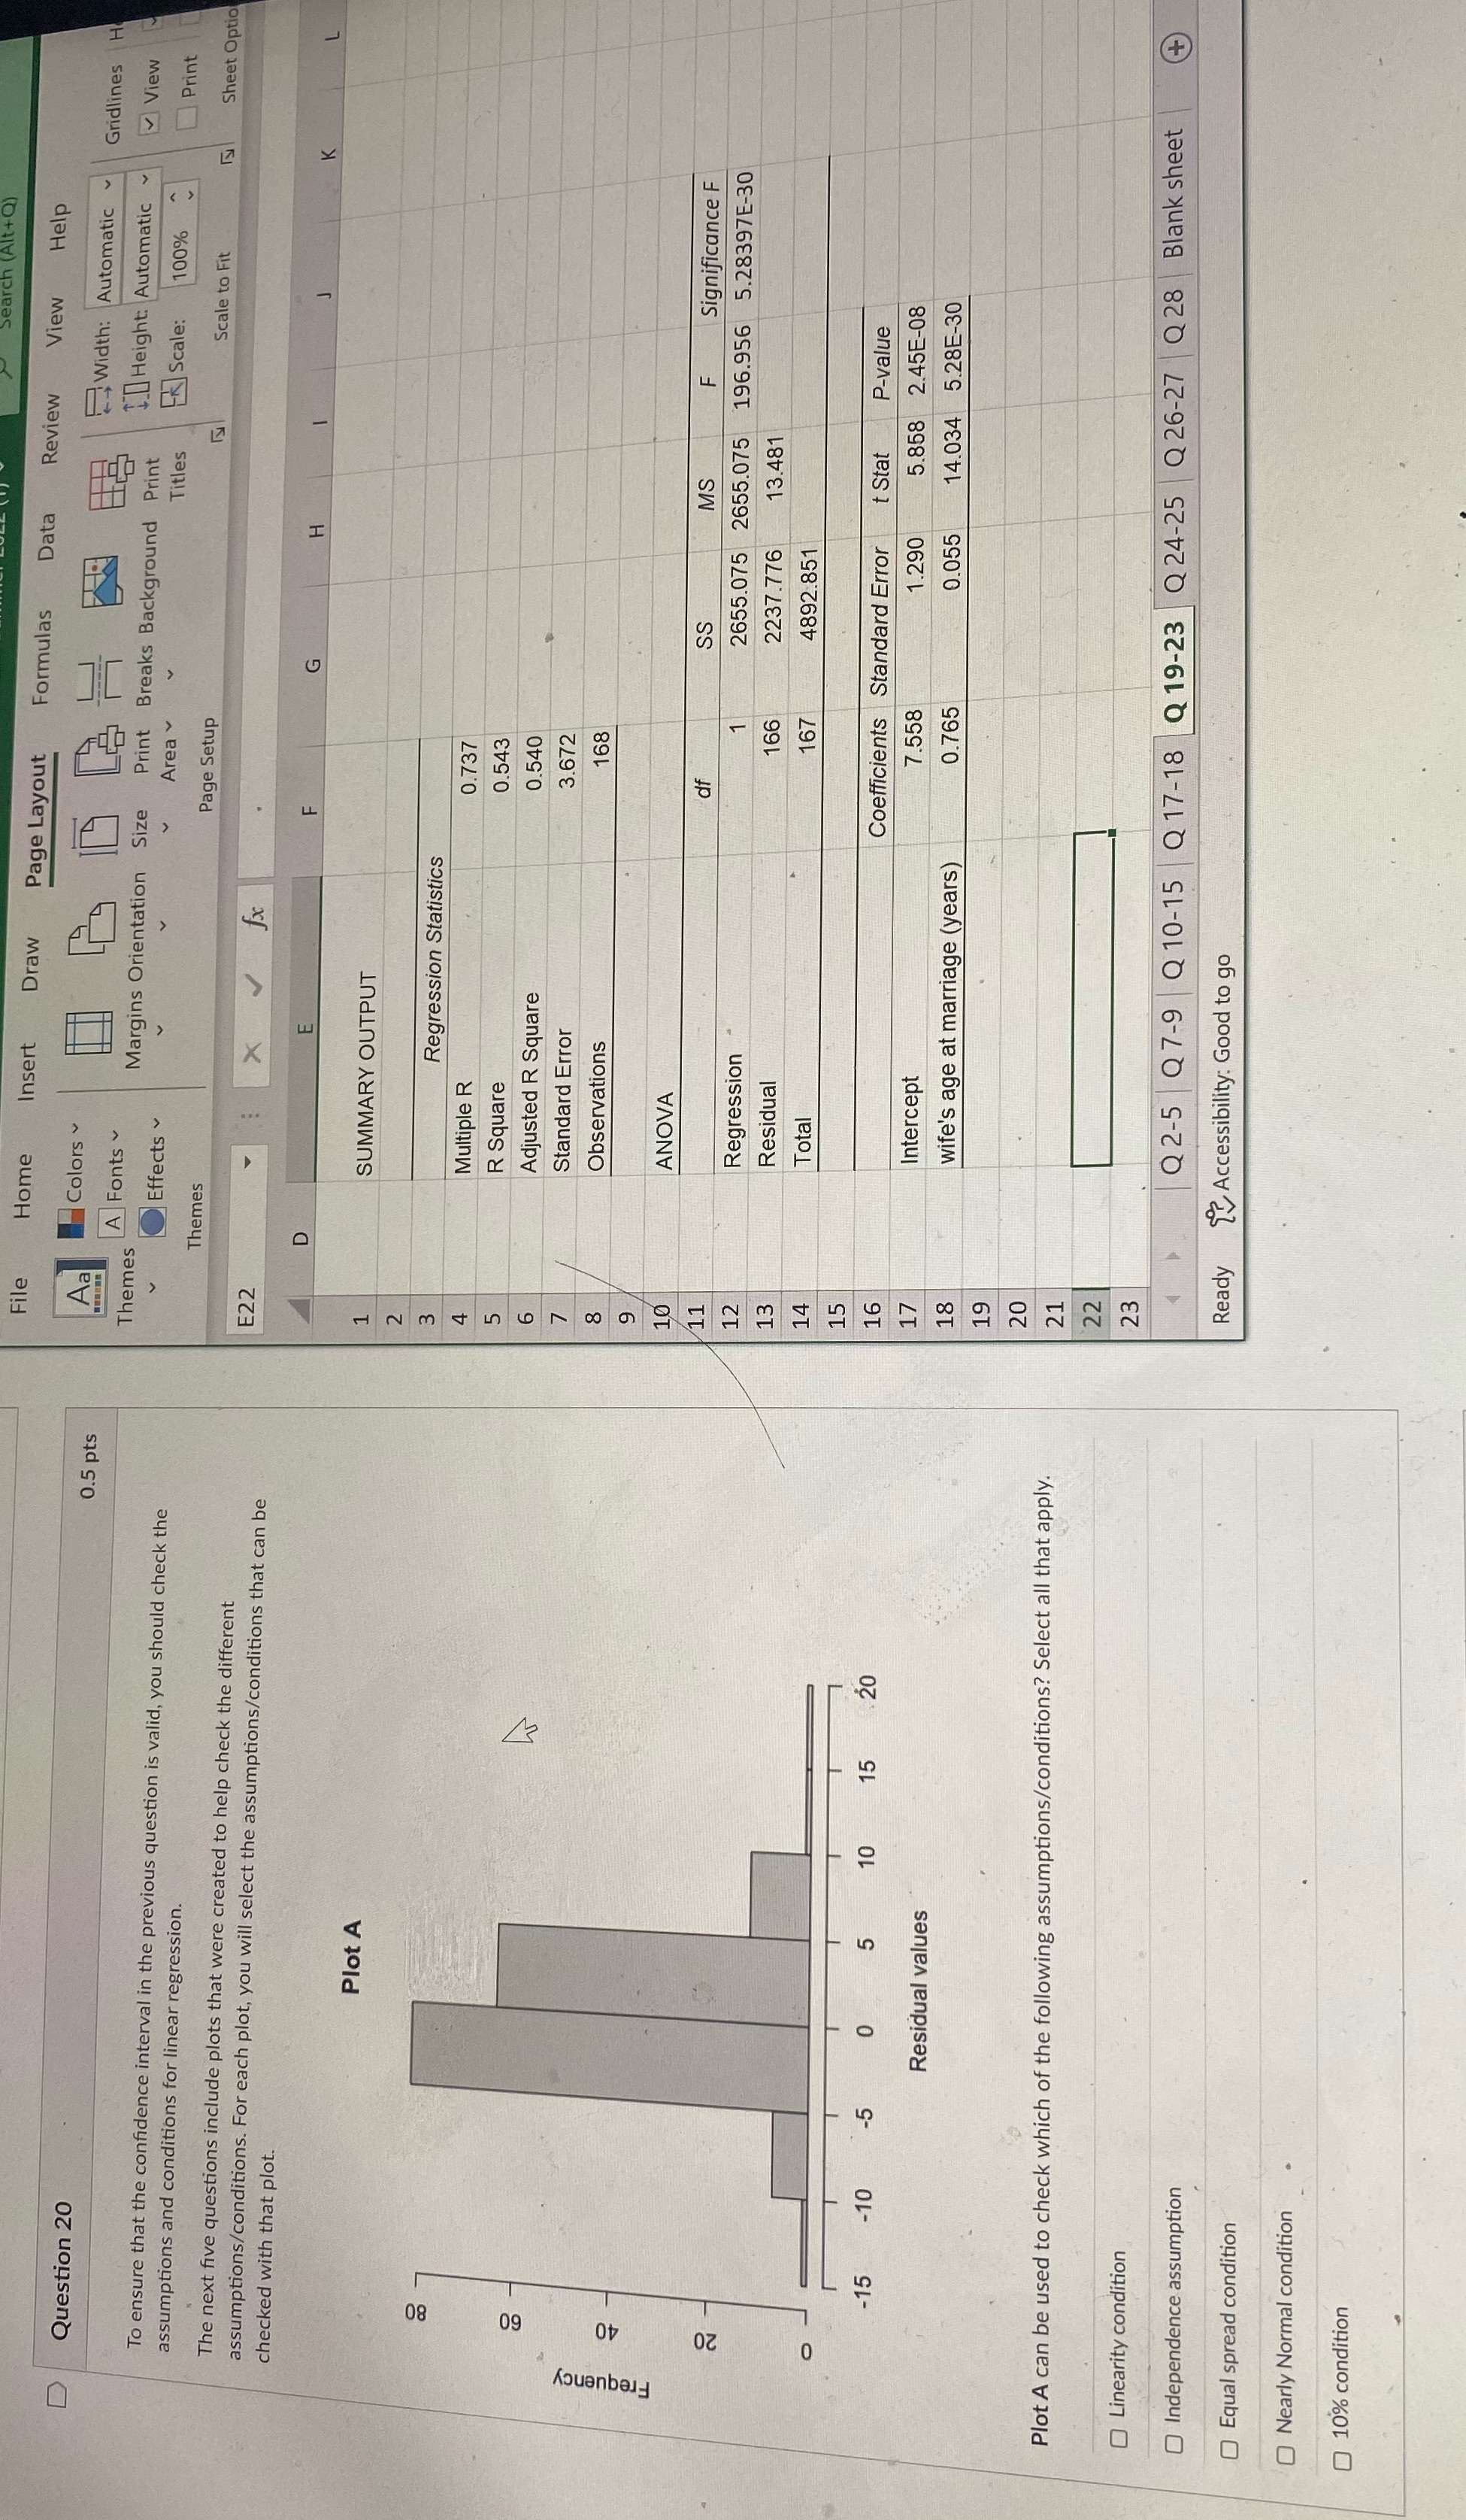
File Home Insert Draw Page Layout Formulas Data Review View Help Question 20 Colors 0.5 pts Width: Automatic Gridlines H A Fonts Themes Margins Orientation Size Print Breaks Background Print Height: Automatic View To ensure that the confidence interval in the previous question is valid, you should check the Effects V Area Titles Scale: 100% Print assumptions and conditions for linear regression. Themes Page Setup Scale to Fit LZ Sheet Option The next five questions include plots that were created to help check the different E22 .. . X assumptions/conditions. For each plot, you will select the assumptions/conditions that can be checked with that plot. LL WU I Plot A SUMMARY OUTPUT Regression Statistics 08 Multiple R 0.737 R Square 0.543 Adjusted R Square 0.540 09 Standard Erro 3.672 Observations 168 Frequency 40 ANOVA SS MS LL Significance F 2655.075 2655.075 196.956 5.28397E-30 20 Regression 13 Residual 166 2237.776 13.481 14 Total 4892.851 LO O C 16 Coefficients Standard Error t Stat P-value -15 -10 17 Intercept 7.558 1.290 5.858 2.45E-08 Residual values 18 wife's age at marriage (years) 0.765 0.055 14.034 5.28E-30 19 20 Plot A can be used to check which of the following assumptions/conditions? Select all that apply. 21 22 23 Linearity condition Q 2-5 Q7-9 Q10-15 Q 17-18 Q19-23 Q 24-25 Q 26-27 Q 28 | Blank sheet + Independence assumption Ready Accessibility: Good to go O Equal spread condition Nearly Normal condition 10% condition
Step by Step Solution
There are 3 Steps involved in it

Get step-by-step solutions from verified subject matter experts