

Question: File Home Insert Page Layout Formulas Data Review AB 1 Bertrand Family Budget Author Date Purpose To provide an overview of the monthly budget of

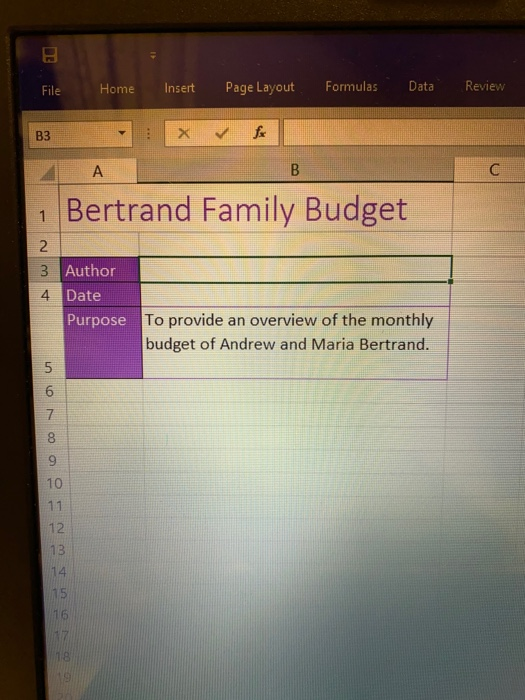
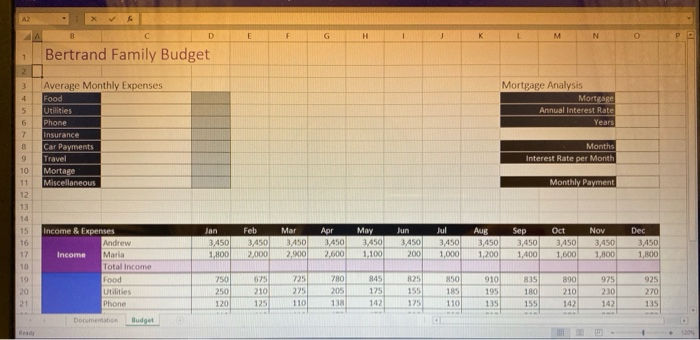
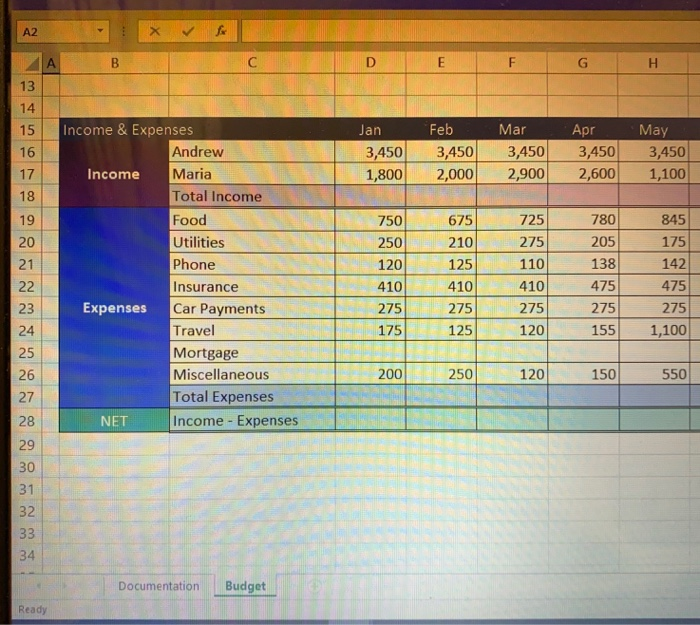
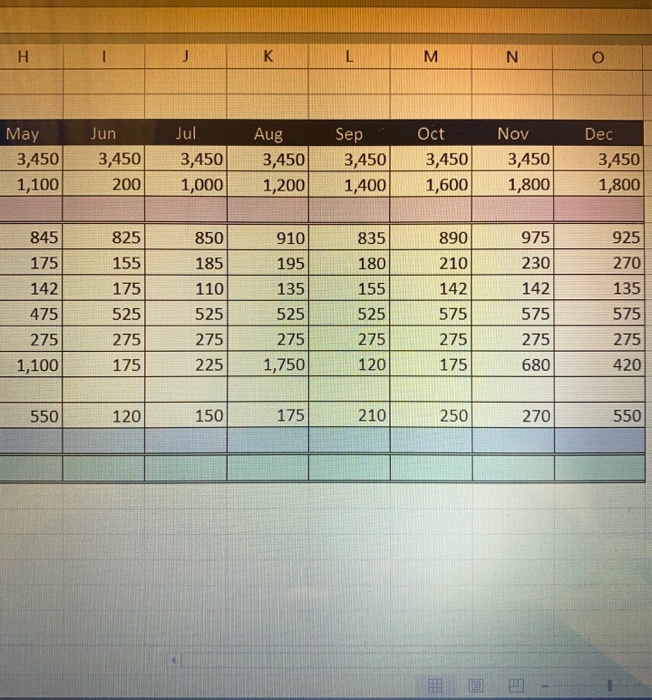
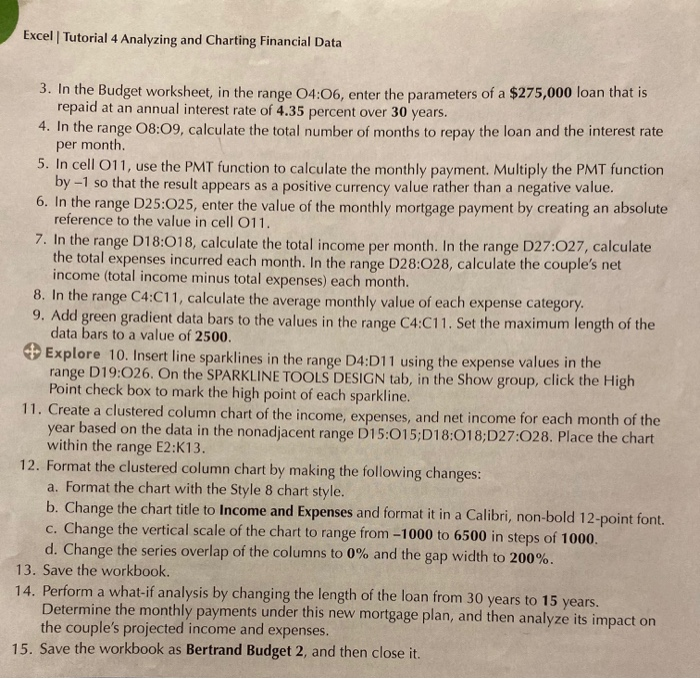
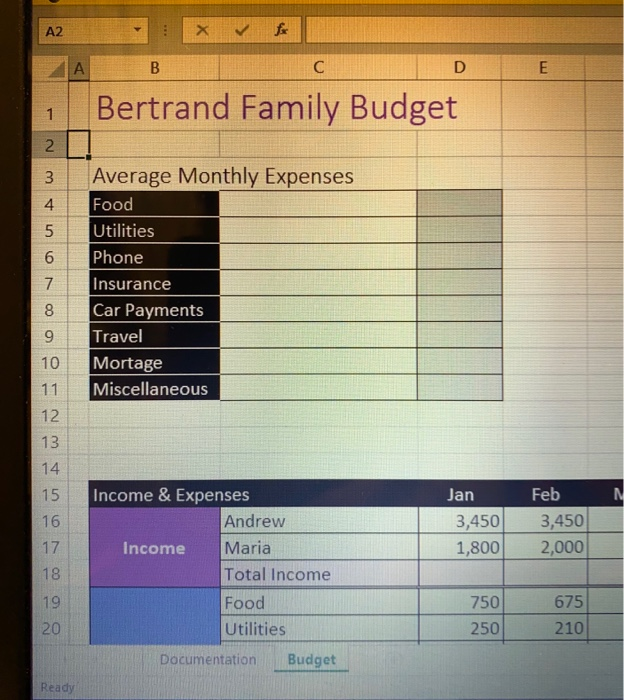
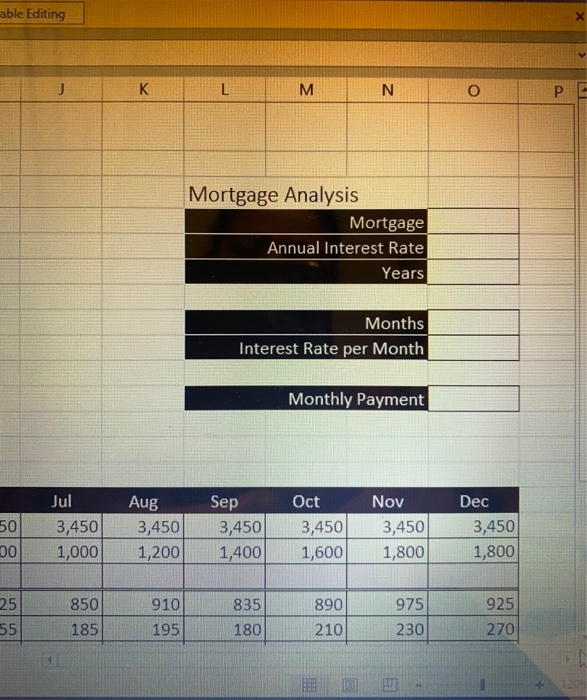
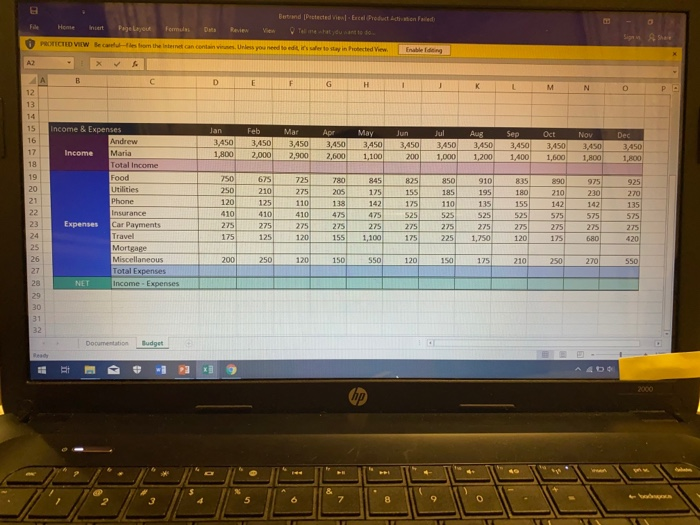
File Home Insert Page Layout Formulas Data Review AB 1 Bertrand Family Budget Author Date Purpose To provide an overview of the monthly budget of Andrew and Maria Bertrand. covou un con NOPP Bertrand Family Budget Mortgage Analysis Mortgage Annual Interest Rate Years Average Monthly Expenses Food Utilities Phone Insurance Car Payments Travel Mortage Miscellaneous Months Interest Rate per Month Monthly Payment Income & Expenses Jan Feb MAT Apr Jul 3,450 3.450 2.900 May 3,450 1.100 3,450 2.600 Aug 3,450 1,200 Sep 3,450 1,400 Oct 3,450 1.600 Nov 3,450 1.800 2006 Dec 3,450 1,800 Income Andrew Maria Total income Food Utilities 010 835 890 975 925 F G H 13 Jan 3,450 1,800 Feb 3,450 2,000 Mar 3,450 2,900 Apr 3,450 2,600 May 3,450 1,100 19 20 21 Income & Expenses Andrew Income Maria Total Income Food Utilities Utilities Phone Insurance F Expenses Car Payments Travel Mortgage Miscellaneous Total Expenses NET Income - Expenses 750 250 120 4 10 275 175 675 210 125 410 275 125 725 275 110 410 275 1 20 780 205 138 475 275 155 845 175 142 475 275 1,100 24 120 150 550 R 200 250 ATES Documentation Budget Ready M N O May 3,450 1,100 Jun 3,450 200 Jul 3,450 1,000 Aug 3,450 1,200 Sep 3,450 Oct 3,450 1,600 3,450 1,800 Dec 3,450 1,800 1000l1 2001 1.400 925 155 850 185 180 270 845 825 175 142 175 475 525 275 275 1,100175 110 525 910 835 890 195 210 135 155 142 525 525 575 275 275 275 1,750120175 975 230 142 575 | 275 680 135 575 275 420 275 225 550 120 150 175 210 250 270 550 Excel | Tutorial 4 Analyzing and Charting Financial Data 3. In the Budget worksheet, in the range 04:06, enter the parameters of a $275,000 loan that is repaid at an annual interest rate of 4.35 percent over 30 years. 4. In the range 08:09, calculate the total number of months to repay the loan and the interest rate per month 5. In cell 011, use the PMT function to calculate the monthly payment. Multiply the PMT function by-1 so that the result appears as a positive currency value rather than a negative value. 6. In the range D25:025, enter the value of the monthly mortgage payment by creating an absolute reference to the value in cell 011. 7. In the range D18:018, calculate the total income per month. In the range D27:027, calculate the total expenses incurred each month. In the range D28:028, calculate the couple's net income (total income minus total expenses) each month. 8. In the range C4:C11, calculate the average monthly value of each expense category. 9. Add green gradient data bars to the values in the range C4:C11. Set the maximum length of the data bars to a value of 2500. Explore 10. Insert line sparklines in the range D4:D11 using the expense values in the range D19:026. On the SPARKLINE TOOLS DESIGN tab, in the Show group, click the High Point check box to mark the high point of each sparkline. 11. Create a clustered column chart of the income, expenses, and net income for each month of the year based on the data in the nonadjacent range D15:015;D18:018;D27:028. Place the chart within the range E2:K13. 12. Format the clustered column chart by making the following changes: a. Format the chart with the Style 8 chart style. b. Change the chart title to Income and Expenses and format it in a Calibri, non-bold 12-point font. c. Change the vertical scale of the chart to range from -1000 to 6500 in steps of 1000. d. Change the series overlap of the columns to 0% and the gap width to 200%. 13. Save the workbook. 14. Perform a what-if analysis by changing the length of the loan from 30 years to 15 years. Determine the monthly payments under this new mortgage plan, and then analyze its impact on the couple's projected income and expenses. 15. Save the workbook as Bertrand Budget 2, and then close it. A2 : * & E 1 Bertrand Family Budget o ocovou AwN Average Monthly Expenses Food Utilities Phone Insurance Car Payments Travel Mortage Miscellaneous o o coa Jan 3,450 1,800 Feb 3,450 2,000 Income & Expenses Andrew Income Maria Total Income Food Utilities Documentation Budget 750 250 675 210 Ready able Editing J K L M N O P E Mortgage Analysis Mortgage Annual Interest Rate Years Months Interest Rate per Month Monthly Payment 50 00 Jul 3,450 1,000 Aug 3,450 1,200 Sep 3,450 1,400 Oct 3,450 1,600 Nov 3,450 1,800 Dec 3,450 1,800 25 55 850 185 910 195 835 180 890 210 975 230 925 270 PROTECTED VIEW Because the instanc e to vary in Protected e d iting AX EFG 3 LMNOP Mortgage Analysis Mortgage Annual Interest Rate Years 5 Average Monthly Expenses Food Utilities Phone Insurance Car Payments Months Interest Rate per Month Mortare Miscellaneous Monthly Payment Jan Feb 3.4503,450 1,800 2,000 Mar 3,450 2,900 Apr 3,450 2.600 May Jun Jul 3,4503,4503,450 1,100 200 1,000 Aug 3,450 1,200 Sep Oct 3,4503,450 1,400 1,600 Nov 3,450 1,800 Dec 3,450 1.800 975 Income & Expenses Andrew Income Maria Total Income Food Utilities Phone Insurance Expenses Car Payments Documentation Budget 210 890 210 925 270 1750675725780 845825850910835 250 275 205 175 155 185 195 180 120 125 110 138142175110 410410 525525 275 2 75 275 275 275 275 275 275 275 135 155 142 135 575 275 File Home incest PRECTED VIEW Bec pojelavou - es from the s formulas Dan et can cont Review en Tell me what you want to do Unless you need to edit is to stay in hotected view Enable 4 Jan 3,450 Feb 3450 2,000 Mar 3,450 2,900 Apr 3,450 2,600 May 3450 1.100 Jun 3,450 200 Jul 3450 1.000 Aug 3,450 1.200 Sep 3,450 1400 Oct 3,450 1,600 Nov 3450 1,800 Dec 3,450 1.800 675 845 725780 205 825 850 835 925 Income & Expenses Andrew Income Maria Total Income Food Utilities Phone Insurance Car Payments Travel Mortgage 890 975 210230 142 142 138 110 . 595 575 575 225 1,750 120 275 175 275 680 150 120 150 175 210 250 270 550 Total Expo ocumentation Budget File Home Insert Page Layout Formulas Data Review AB 1 Bertrand Family Budget Author Date Purpose To provide an overview of the monthly budget of Andrew and Maria Bertrand. covou un con NOPP Bertrand Family Budget Mortgage Analysis Mortgage Annual Interest Rate Years Average Monthly Expenses Food Utilities Phone Insurance Car Payments Travel Mortage Miscellaneous Months Interest Rate per Month Monthly Payment Income & Expenses Jan Feb MAT Apr Jul 3,450 3.450 2.900 May 3,450 1.100 3,450 2.600 Aug 3,450 1,200 Sep 3,450 1,400 Oct 3,450 1.600 Nov 3,450 1.800 2006 Dec 3,450 1,800 Income Andrew Maria Total income Food Utilities 010 835 890 975 925 F G H 13 Jan 3,450 1,800 Feb 3,450 2,000 Mar 3,450 2,900 Apr 3,450 2,600 May 3,450 1,100 19 20 21 Income & Expenses Andrew Income Maria Total Income Food Utilities Utilities Phone Insurance F Expenses Car Payments Travel Mortgage Miscellaneous Total Expenses NET Income - Expenses 750 250 120 4 10 275 175 675 210 125 410 275 125 725 275 110 410 275 1 20 780 205 138 475 275 155 845 175 142 475 275 1,100 24 120 150 550 R 200 250 ATES Documentation Budget Ready M N O May 3,450 1,100 Jun 3,450 200 Jul 3,450 1,000 Aug 3,450 1,200 Sep 3,450 Oct 3,450 1,600 3,450 1,800 Dec 3,450 1,800 1000l1 2001 1.400 925 155 850 185 180 270 845 825 175 142 175 475 525 275 275 1,100175 110 525 910 835 890 195 210 135 155 142 525 525 575 275 275 275 1,750120175 975 230 142 575 | 275 680 135 575 275 420 275 225 550 120 150 175 210 250 270 550 Excel | Tutorial 4 Analyzing and Charting Financial Data 3. In the Budget worksheet, in the range 04:06, enter the parameters of a $275,000 loan that is repaid at an annual interest rate of 4.35 percent over 30 years. 4. In the range 08:09, calculate the total number of months to repay the loan and the interest rate per month 5. In cell 011, use the PMT function to calculate the monthly payment. Multiply the PMT function by-1 so that the result appears as a positive currency value rather than a negative value. 6. In the range D25:025, enter the value of the monthly mortgage payment by creating an absolute reference to the value in cell 011. 7. In the range D18:018, calculate the total income per month. In the range D27:027, calculate the total expenses incurred each month. In the range D28:028, calculate the couple's net income (total income minus total expenses) each month. 8. In the range C4:C11, calculate the average monthly value of each expense category. 9. Add green gradient data bars to the values in the range C4:C11. Set the maximum length of the data bars to a value of 2500. Explore 10. Insert line sparklines in the range D4:D11 using the expense values in the range D19:026. On the SPARKLINE TOOLS DESIGN tab, in the Show group, click the High Point check box to mark the high point of each sparkline. 11. Create a clustered column chart of the income, expenses, and net income for each month of the year based on the data in the nonadjacent range D15:015;D18:018;D27:028. Place the chart within the range E2:K13. 12. Format the clustered column chart by making the following changes: a. Format the chart with the Style 8 chart style. b. Change the chart title to Income and Expenses and format it in a Calibri, non-bold 12-point font. c. Change the vertical scale of the chart to range from -1000 to 6500 in steps of 1000. d. Change the series overlap of the columns to 0% and the gap width to 200%. 13. Save the workbook. 14. Perform a what-if analysis by changing the length of the loan from 30 years to 15 years. Determine the monthly payments under this new mortgage plan, and then analyze its impact on the couple's projected income and expenses. 15. Save the workbook as Bertrand Budget 2, and then close it. A2 : * & E 1 Bertrand Family Budget o ocovou AwN Average Monthly Expenses Food Utilities Phone Insurance Car Payments Travel Mortage Miscellaneous o o coa Jan 3,450 1,800 Feb 3,450 2,000 Income & Expenses Andrew Income Maria Total Income Food Utilities Documentation Budget 750 250 675 210 Ready able Editing J K L M N O P E Mortgage Analysis Mortgage Annual Interest Rate Years Months Interest Rate per Month Monthly Payment 50 00 Jul 3,450 1,000 Aug 3,450 1,200 Sep 3,450 1,400 Oct 3,450 1,600 Nov 3,450 1,800 Dec 3,450 1,800 25 55 850 185 910 195 835 180 890 210 975 230 925 270 PROTECTED VIEW Because the instanc e to vary in Protected e d iting AX EFG 3 LMNOP Mortgage Analysis Mortgage Annual Interest Rate Years 5 Average Monthly Expenses Food Utilities Phone Insurance Car Payments Months Interest Rate per Month Mortare Miscellaneous Monthly Payment Jan Feb 3.4503,450 1,800 2,000 Mar 3,450 2,900 Apr 3,450 2.600 May Jun Jul 3,4503,4503,450 1,100 200 1,000 Aug 3,450 1,200 Sep Oct 3,4503,450 1,400 1,600 Nov 3,450 1,800 Dec 3,450 1.800 975 Income & Expenses Andrew Income Maria Total Income Food Utilities Phone Insurance Expenses Car Payments Documentation Budget 210 890 210 925 270 1750675725780 845825850910835 250 275 205 175 155 185 195 180 120 125 110 138142175110 410410 525525 275 2 75 275 275 275 275 275 275 275 135 155 142 135 575 275 File Home incest PRECTED VIEW Bec pojelavou - es from the s formulas Dan et can cont Review en Tell me what you want to do Unless you need to edit is to stay in hotected view Enable 4 Jan 3,450 Feb 3450 2,000 Mar 3,450 2,900 Apr 3,450 2,600 May 3450 1.100 Jun 3,450 200 Jul 3450 1.000 Aug 3,450 1.200 Sep 3,450 1400 Oct 3,450 1,600 Nov 3450 1,800 Dec 3,450 1.800 675 845 725780 205 825 850 835 925 Income & Expenses Andrew Income Maria Total Income Food Utilities Phone Insurance Car Payments Travel Mortgage 890 975 210230 142 142 138 110 . 595 575 575 225 1,750 120 275 175 275 680 150 120 150 175 210 250 270 550 Total Expo ocumentation Budget
Step by Step Solution
There are 3 Steps involved in it

Get step-by-step solutions from verified subject matter experts