

Question: file:///C:/Users/maseel/Desktop/Request.xlsx Use the data listed for Part a. Use the IRIS dataset for the other parts. a. Plot an equi-width histogram of width 10. b.
file:///C:/Users/maseel/Desktop/Request.xlsx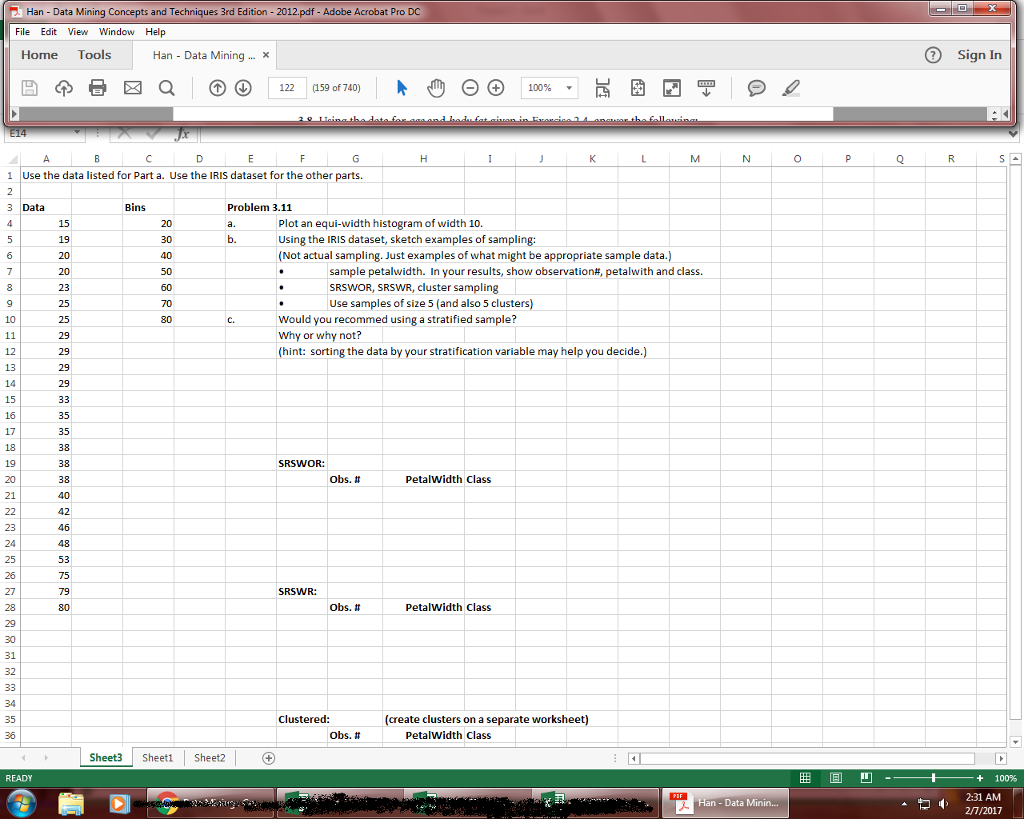
Use the data listed for Part a. Use the IRIS dataset for the other parts. a. Plot an equi-width histogram of width 10. b. Using the IRIS dataset, sketch examples of sampling: (Not actual sampling. Just examples of what might be appropriate sample data.) sample petalwidth. In your results, show observation#, petalwith and class. SRSWOR, SRSWR, duster sampling Use samples of size 5 (and also 5 clusters) c. Would you recommed using a stratified sample? Why or why not
Step by Step Solution
There are 3 Steps involved in it
1 Expert Approved Answer
Step: 1 Unlock

Question Has Been Solved by an Expert!
Get step-by-step solutions from verified subject matter experts
Step: 2 Unlock
Step: 3 Unlock