

Question: FILL IN HIGHLIGHTED SECTION BELOW FOR ADJUSTING AND CLOSING ENTRIES USE THE BELOW INFORMATION FOR CALCULATIONS Fixed assets have no salvage value over a 10
FILL IN HIGHLIGHTED SECTION BELOW FOR ADJUSTING AND CLOSING ENTRIES
 USE THE BELOW INFORMATION FOR CALCULATIONS
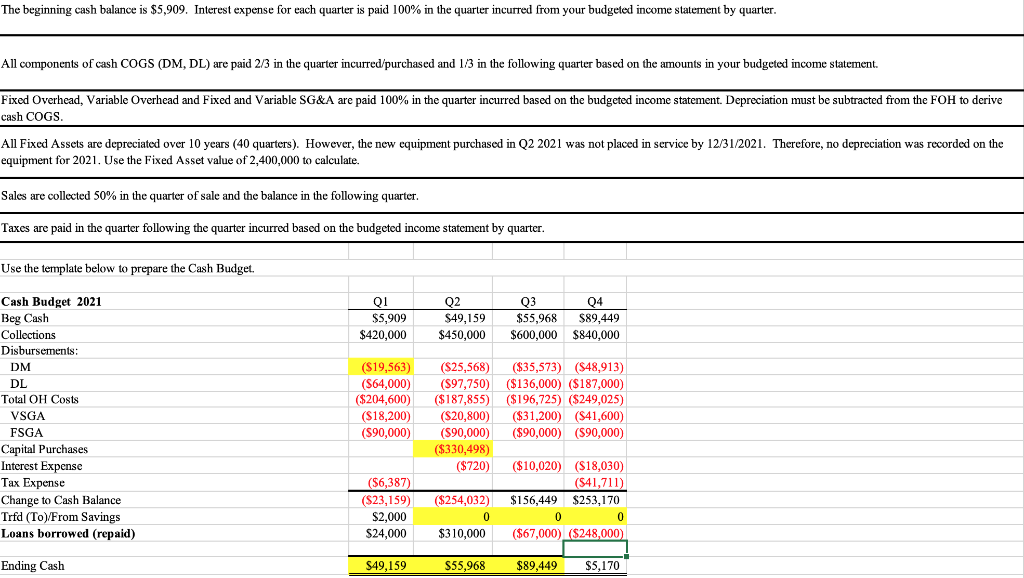
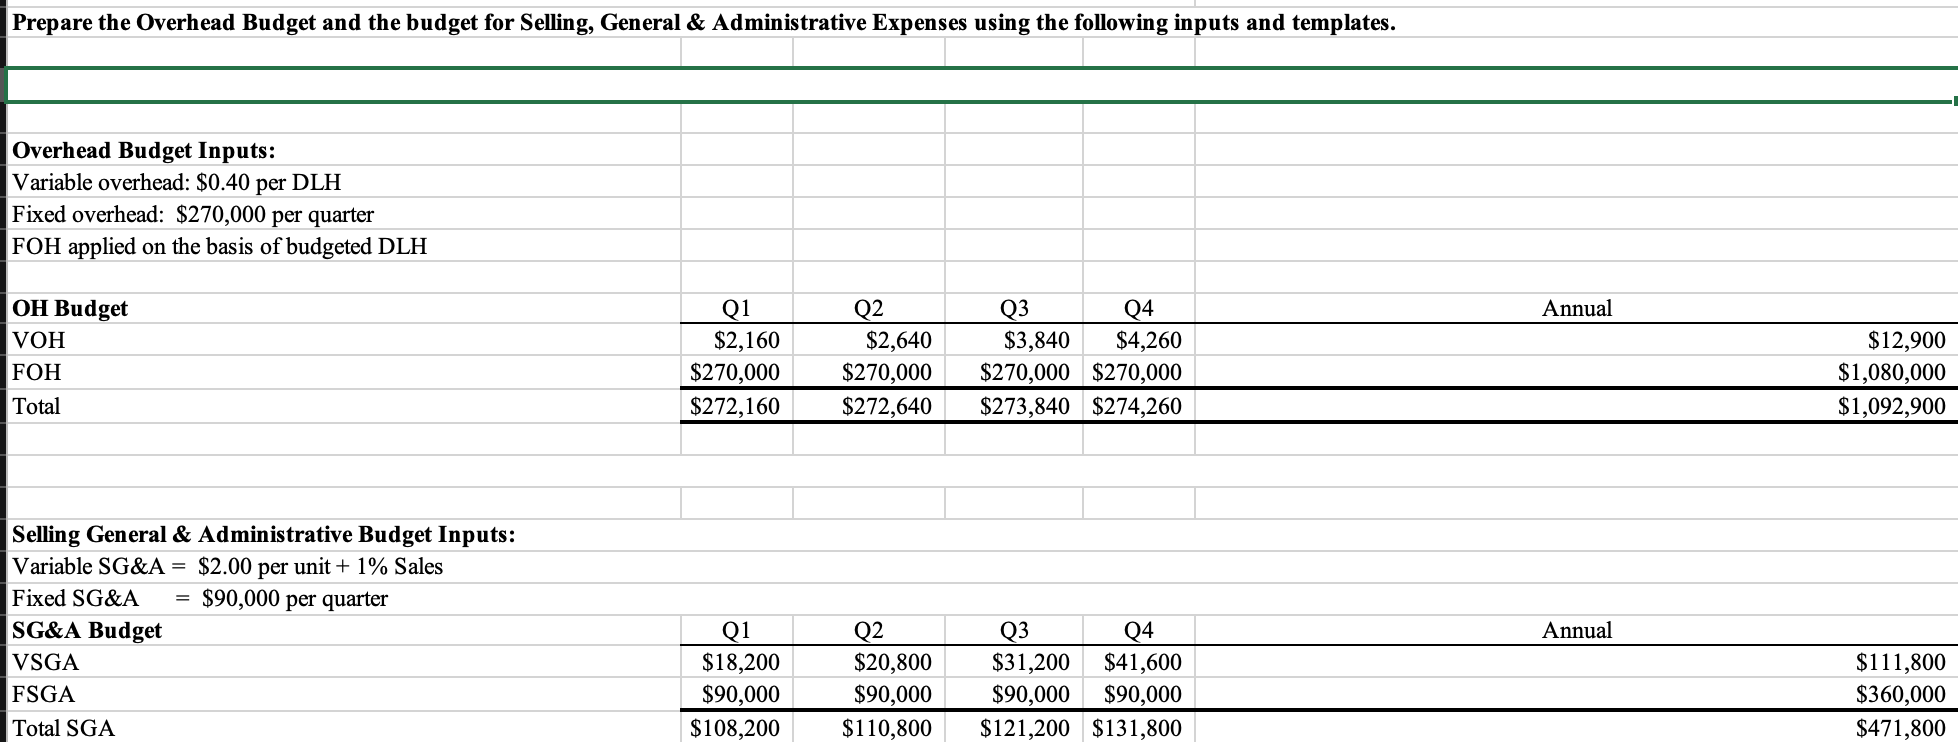
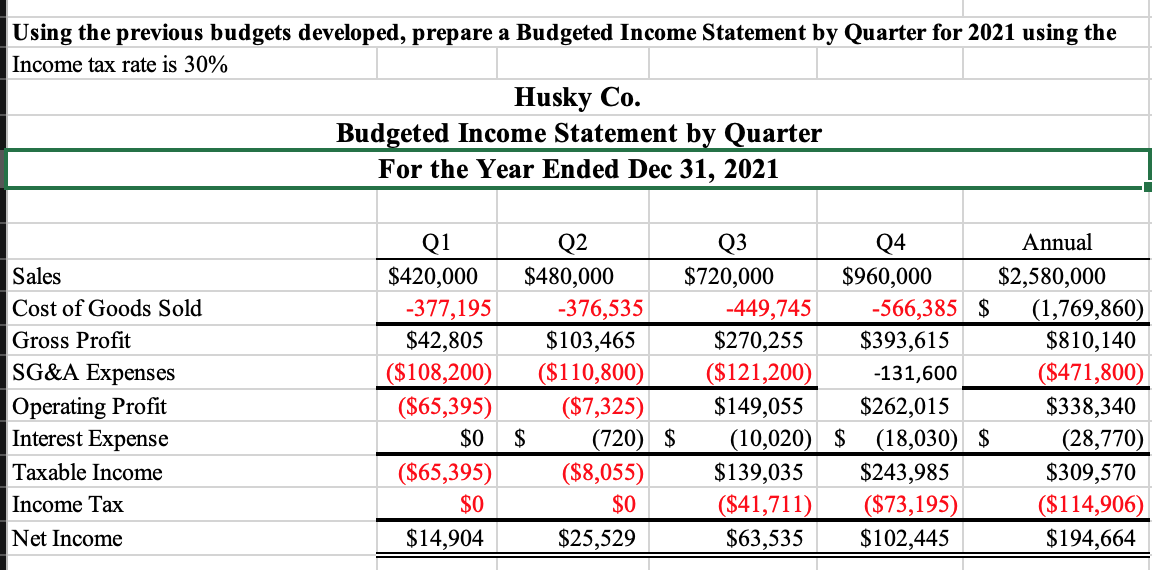
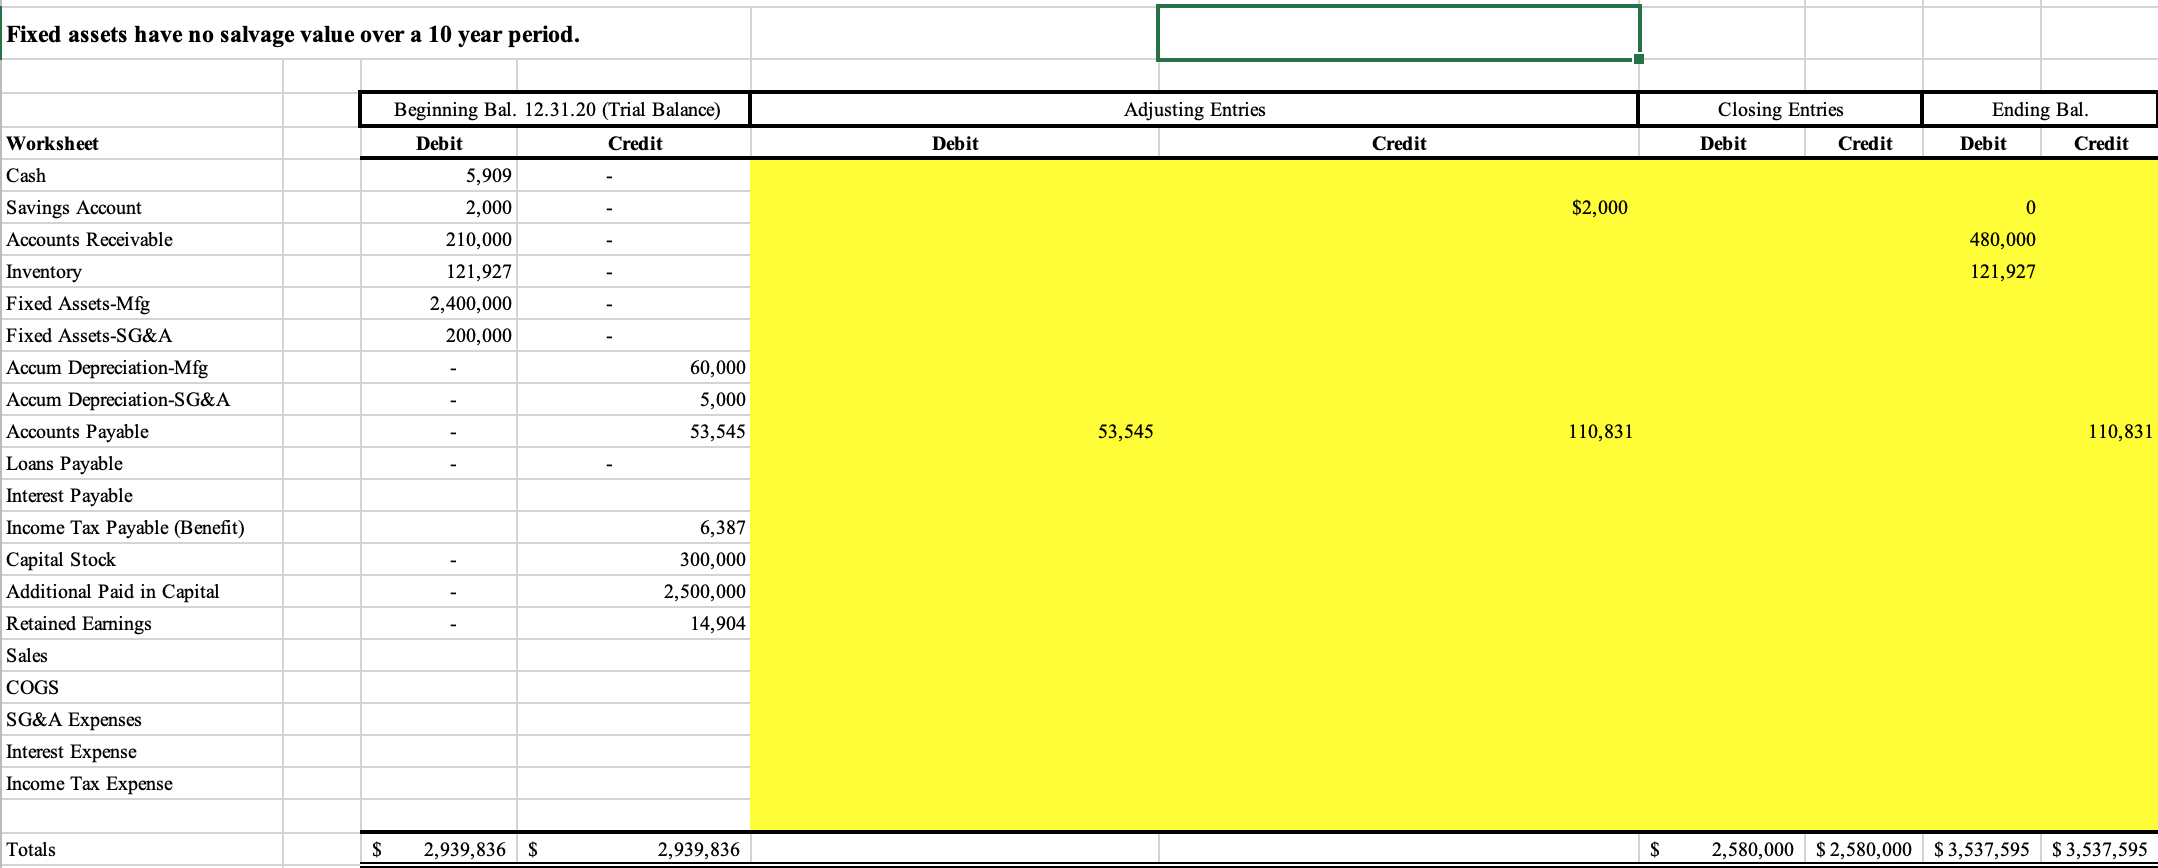
Fixed assets have no salvage value over a 10 year period. Beginning Bal. 12.31.20 (Trial Balance) Adjusting Entries Closing Entries Debit Credit Ending Bal. Debit Credit Debit Credit Debit Credit $2,000 0 480,000 5,909 2,000 210,000 121,927 2,400,000 200,000 121,927 Worksheet Cash Savings Account Accounts Receivable Inventory Fixed Assets-Mfg Fixed Assets-SG&A Accum Depreciation-Mfg Accum Depreciation-SG&A Accounts Payable Loans Payable Interest Payable Income Tax Payable (Benefit) Capital Stock Additional Paid in Capital Retained Earnings Sales 60,000 5,000 53,545 53,545 110,831 110,831 6,387 300,000 2,500,000 14,904 COGS SG&A Expenses Interest Expense Income Tax Expense Totals $ 2,939,836 $ 2,939,836 $ 2,580,000 $2,580,000 $3,537,595 $3,537,595 The beginning cash balance is $5,909. Interest expense for each quarter is paid 100% in the quarter incurred from your budgeted income statement by quarter. All components of cash COGS (DM, DL) are paid 2/3 in the quarter incurred/purchased and 1/3 in the following quarter based on the amounts in your budgeted income statement. Fixed Overhead, Variable Overhead and Fixed and Variable SG&A are paid 100% in the quarter incurred based on the budgeted income statement. Depreciation must be subtracted from the FOH to derive cash COGS. All Fixed Assets are depreciated over 10 years (40 quarters). However, the new equipment purchased in Q2 2021 was not placed in service by 12/31/2021. Therefore, no depreciation was recorded on the equipment for 2021. Use the Fixed Asset value of 2,400,000 to calculate. Sales are collected 50% in the quarter of sale and the balance in the following quarter. Taxes are paid in the quarter following the quarter incurred based on the budgeted income statement by quarter. Use the template below to prepare the Cash Budget. Q1 $5,909 $420,000 Q2 $49,159 $450,000 Q3 04 $55,968 $89,449 $600,000 $840,000 Cash Budget 2021 Beg Cash Collections Disbursements: DM DL Total OH Costs VSGA FSGA Capital Purchases Interest Expense Tax Expense Change to Cash Balance Trfd (To/From Savings Loans borrowed (repaid) ($19,563) (564,000) ($204,600) ($18,200) (590,000) (S25,568 ($35,573) ($48,913) ($97,750) ($136,000) ($187,000) ($187,855) ($196,725) ($249,025) ($20,800) ($31,200) ($41,600) (590,000) ($90,000) ($90,000) ($330,498) ($720) ($10,020) ($18,030) (541,711) ($254,032) $156,449 $253,170 0 0 0 $310,000 ($67,000) ($248,000) ($6,387) (S23,159) $2,000 $24,000 Ending Cash S49,159 $55,968 $89,449 $5,170 Prepare the Overhead Budget and the budget for Selling, General & Administrative Expenses using the following inputs and templates. Overhead Budget Inputs: Variable overhead: $0.40 per DLH Fixed overhead: $270,000 per quarter FOH applied on the basis of budgeted DLH Annual OH Budget VOH FOH Total Q1 $2,160 $270,000 $272,160 Q2 $2,640 $270,000 $272,640 Q3 Q4 $3,840 $4,260 $270,000 $270,000 $273,840 $274,260 $12,900 $1,080,000 $1,092,900 Selling General & Administrative Budget Inputs: Variable SG&A = $2.00 per unit + 1% Sales Fixed SG&A $90,000 per quarter SG&A Budget VSGA FSGA Total SGA Annual Q1 $18,200 $90,000 $108,200 Q2 $20,800 $90,000 $110,800 Q3 Q4 $31,200 $41,600 $90,000 $90,000 $121,200 $131,800 $111,800 $360,000 $471,800 Using the previous budgets developed, prepare a Budgeted Income Statement by Quarter for 2021 using the Income tax rate is 30% Husky Co. Budgeted Income Statement by Quarter For the Year Ended Dec 31, 2021 Sales Cost of Goods Sold Gross Profit SG&A Expenses Operating Profit Interest Expense Taxable Income Income Tax Net Income Q1 $420,000 -377,195 $42,805 ($108,200) ($65,395) $0 ($65,395) $0 $14,904 Q2 Q3 Q4 Annual $480,000 $720,000 $960,000 $2,580,000 -376,535 -449,745 -566,385 $ (1,769,860) $103,465 $270,255 $393,615 $810,140 ($110,800) ($121,200) -131,600 ($471,800) ($7,325) $149,055 $262,015 $338,340 $ (720) $ (10,020) $ (18,030) $ (28,770) ($8,055) $139,035 $243,985 $309,570 $0 ($41,711) ($73,195) ($114,906) $25,529 $63,535 $102,445 $194,664 Fixed assets have no salvage value over a 10 year period. Beginning Bal. 12.31.20 (Trial Balance) Adjusting Entries Closing Entries Debit Credit Ending Bal. Debit Credit Debit Credit Debit Credit $2,000 0 480,000 5,909 2,000 210,000 121,927 2,400,000 200,000 121,927 Worksheet Cash Savings Account Accounts Receivable Inventory Fixed Assets-Mfg Fixed Assets-SG&A Accum Depreciation-Mfg Accum Depreciation-SG&A Accounts Payable Loans Payable Interest Payable Income Tax Payable (Benefit) Capital Stock Additional Paid in Capital Retained Earnings Sales 60,000 5,000 53,545 53,545 110,831 110,831 6,387 300,000 2,500,000 14,904 COGS SG&A Expenses Interest Expense Income Tax Expense Totals $ 2,939,836 $ 2,939,836 $ 2,580,000 $2,580,000 $3,537,595 $3,537,595 The beginning cash balance is $5,909. Interest expense for each quarter is paid 100% in the quarter incurred from your budgeted income statement by quarter. All components of cash COGS (DM, DL) are paid 2/3 in the quarter incurred/purchased and 1/3 in the following quarter based on the amounts in your budgeted income statement. Fixed Overhead, Variable Overhead and Fixed and Variable SG&A are paid 100% in the quarter incurred based on the budgeted income statement. Depreciation must be subtracted from the FOH to derive cash COGS. All Fixed Assets are depreciated over 10 years (40 quarters). However, the new equipment purchased in Q2 2021 was not placed in service by 12/31/2021. Therefore, no depreciation was recorded on the equipment for 2021. Use the Fixed Asset value of 2,400,000 to calculate. Sales are collected 50% in the quarter of sale and the balance in the following quarter. Taxes are paid in the quarter following the quarter incurred based on the budgeted income statement by quarter. Use the template below to prepare the Cash Budget. Q1 $5,909 $420,000 Q2 $49,159 $450,000 Q3 04 $55,968 $89,449 $600,000 $840,000 Cash Budget 2021 Beg Cash Collections Disbursements: DM DL Total OH Costs VSGA FSGA Capital Purchases Interest Expense Tax Expense Change to Cash Balance Trfd (To/From Savings Loans borrowed (repaid) ($19,563) (564,000) ($204,600) ($18,200) (590,000) (S25,568 ($35,573) ($48,913) ($97,750) ($136,000) ($187,000) ($187,855) ($196,725) ($249,025) ($20,800) ($31,200) ($41,600) (590,000) ($90,000) ($90,000) ($330,498) ($720) ($10,020) ($18,030) (541,711) ($254,032) $156,449 $253,170 0 0 0 $310,000 ($67,000) ($248,000) ($6,387) (S23,159) $2,000 $24,000 Ending Cash S49,159 $55,968 $89,449 $5,170 Prepare the Overhead Budget and the budget for Selling, General & Administrative Expenses using the following inputs and templates. Overhead Budget Inputs: Variable overhead: $0.40 per DLH Fixed overhead: $270,000 per quarter FOH applied on the basis of budgeted DLH Annual OH Budget VOH FOH Total Q1 $2,160 $270,000 $272,160 Q2 $2,640 $270,000 $272,640 Q3 Q4 $3,840 $4,260 $270,000 $270,000 $273,840 $274,260 $12,900 $1,080,000 $1,092,900 Selling General & Administrative Budget Inputs: Variable SG&A = $2.00 per unit + 1% Sales Fixed SG&A $90,000 per quarter SG&A Budget VSGA FSGA Total SGA Annual Q1 $18,200 $90,000 $108,200 Q2 $20,800 $90,000 $110,800 Q3 Q4 $31,200 $41,600 $90,000 $90,000 $121,200 $131,800 $111,800 $360,000 $471,800 Using the previous budgets developed, prepare a Budgeted Income Statement by Quarter for 2021 using the Income tax rate is 30% Husky Co. Budgeted Income Statement by Quarter For the Year Ended Dec 31, 2021 Sales Cost of Goods Sold Gross Profit SG&A Expenses Operating Profit Interest Expense Taxable Income Income Tax Net Income Q1 $420,000 -377,195 $42,805 ($108,200) ($65,395) $0 ($65,395) $0 $14,904 Q2 Q3 Q4 Annual $480,000 $720,000 $960,000 $2,580,000 -376,535 -449,745 -566,385 $ (1,769,860) $103,465 $270,255 $393,615 $810,140 ($110,800) ($121,200) -131,600 ($471,800) ($7,325) $149,055 $262,015 $338,340 $ (720) $ (10,020) $ (18,030) $ (28,770) ($8,055) $139,035 $243,985 $309,570 $0 ($41,711) ($73,195) ($114,906) $25,529 $63,535 $102,445 $194,664
Step by Step Solution
There are 3 Steps involved in it

Get step-by-step solutions from verified subject matter experts