

Question: Fill in ratios using the resources below to help Apple Inc CONSOLIDATED BALANCE SHEET (In millions, except number of shares which are reflected in thousands
Fill in ratios using the resources below to help
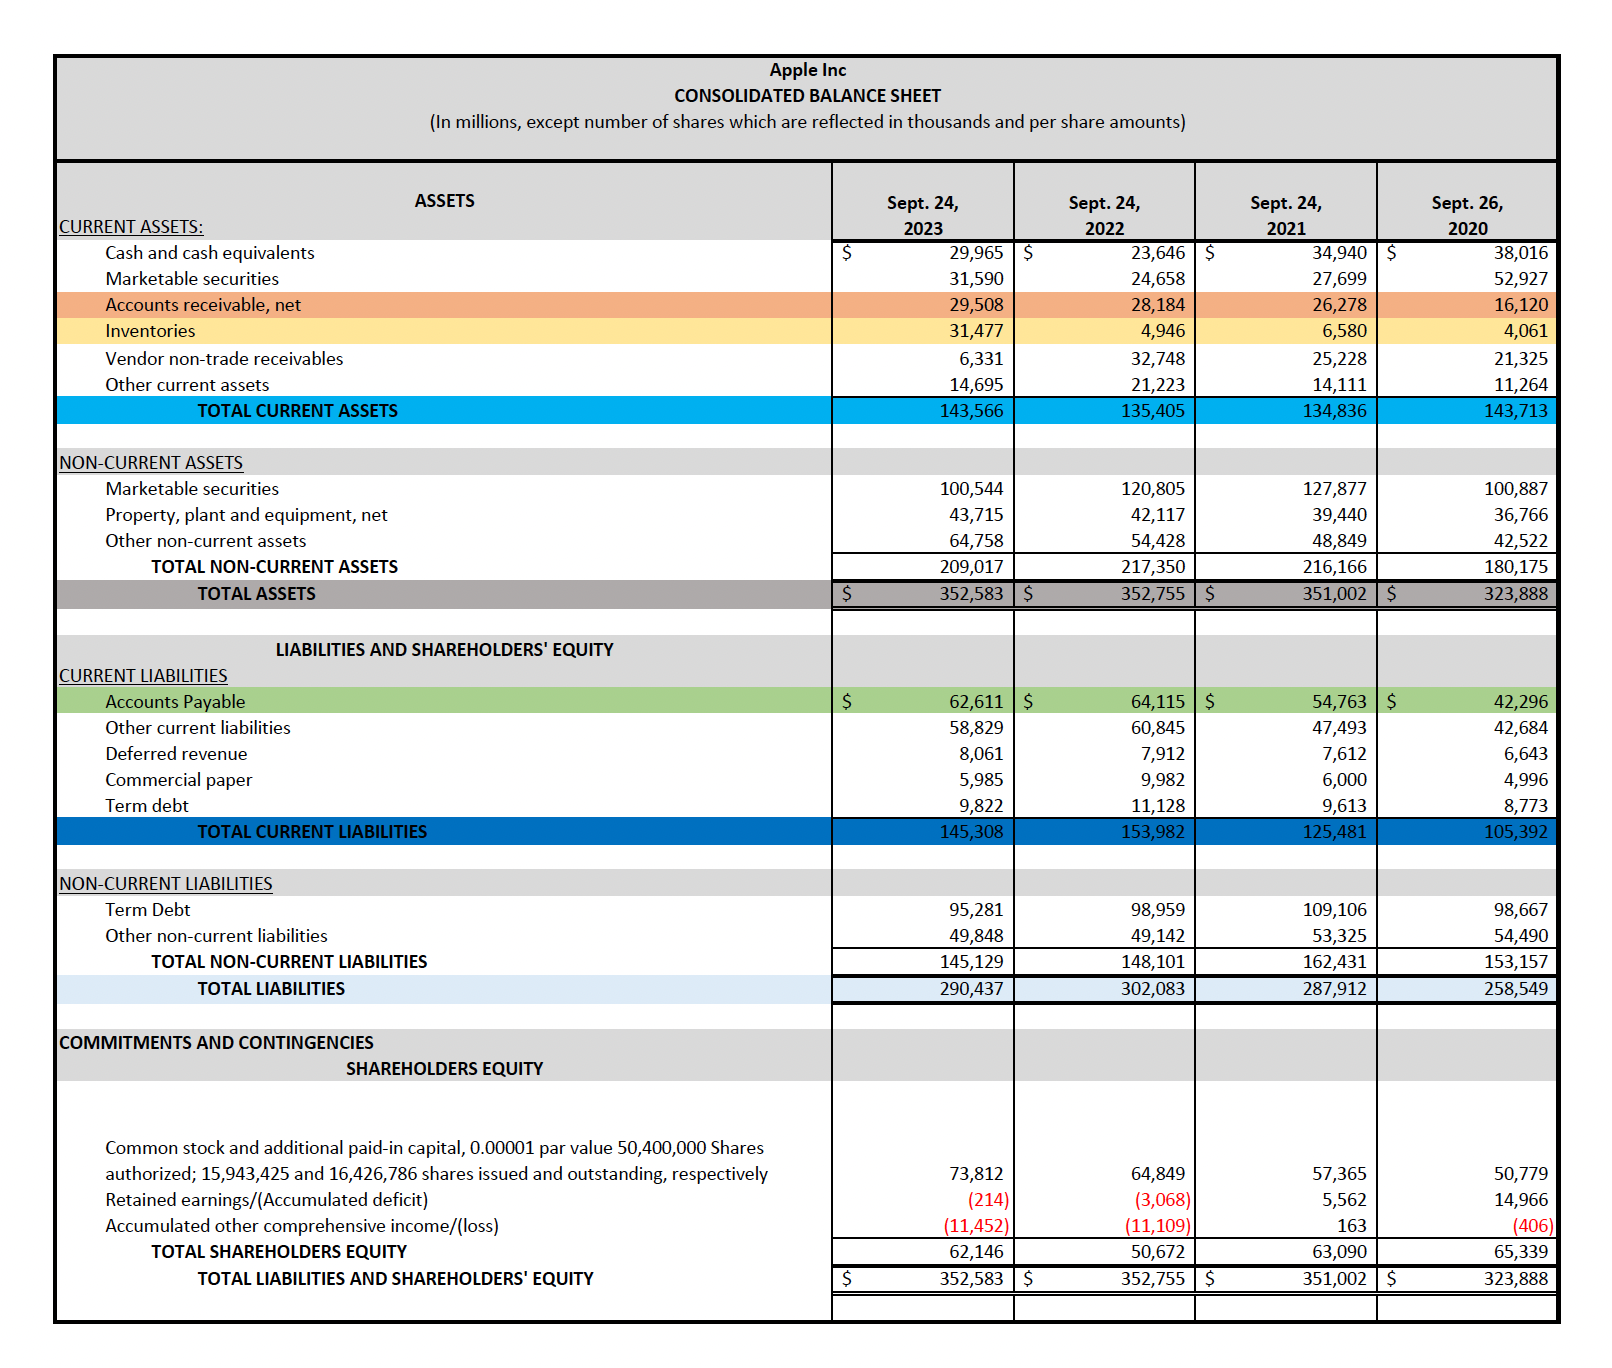
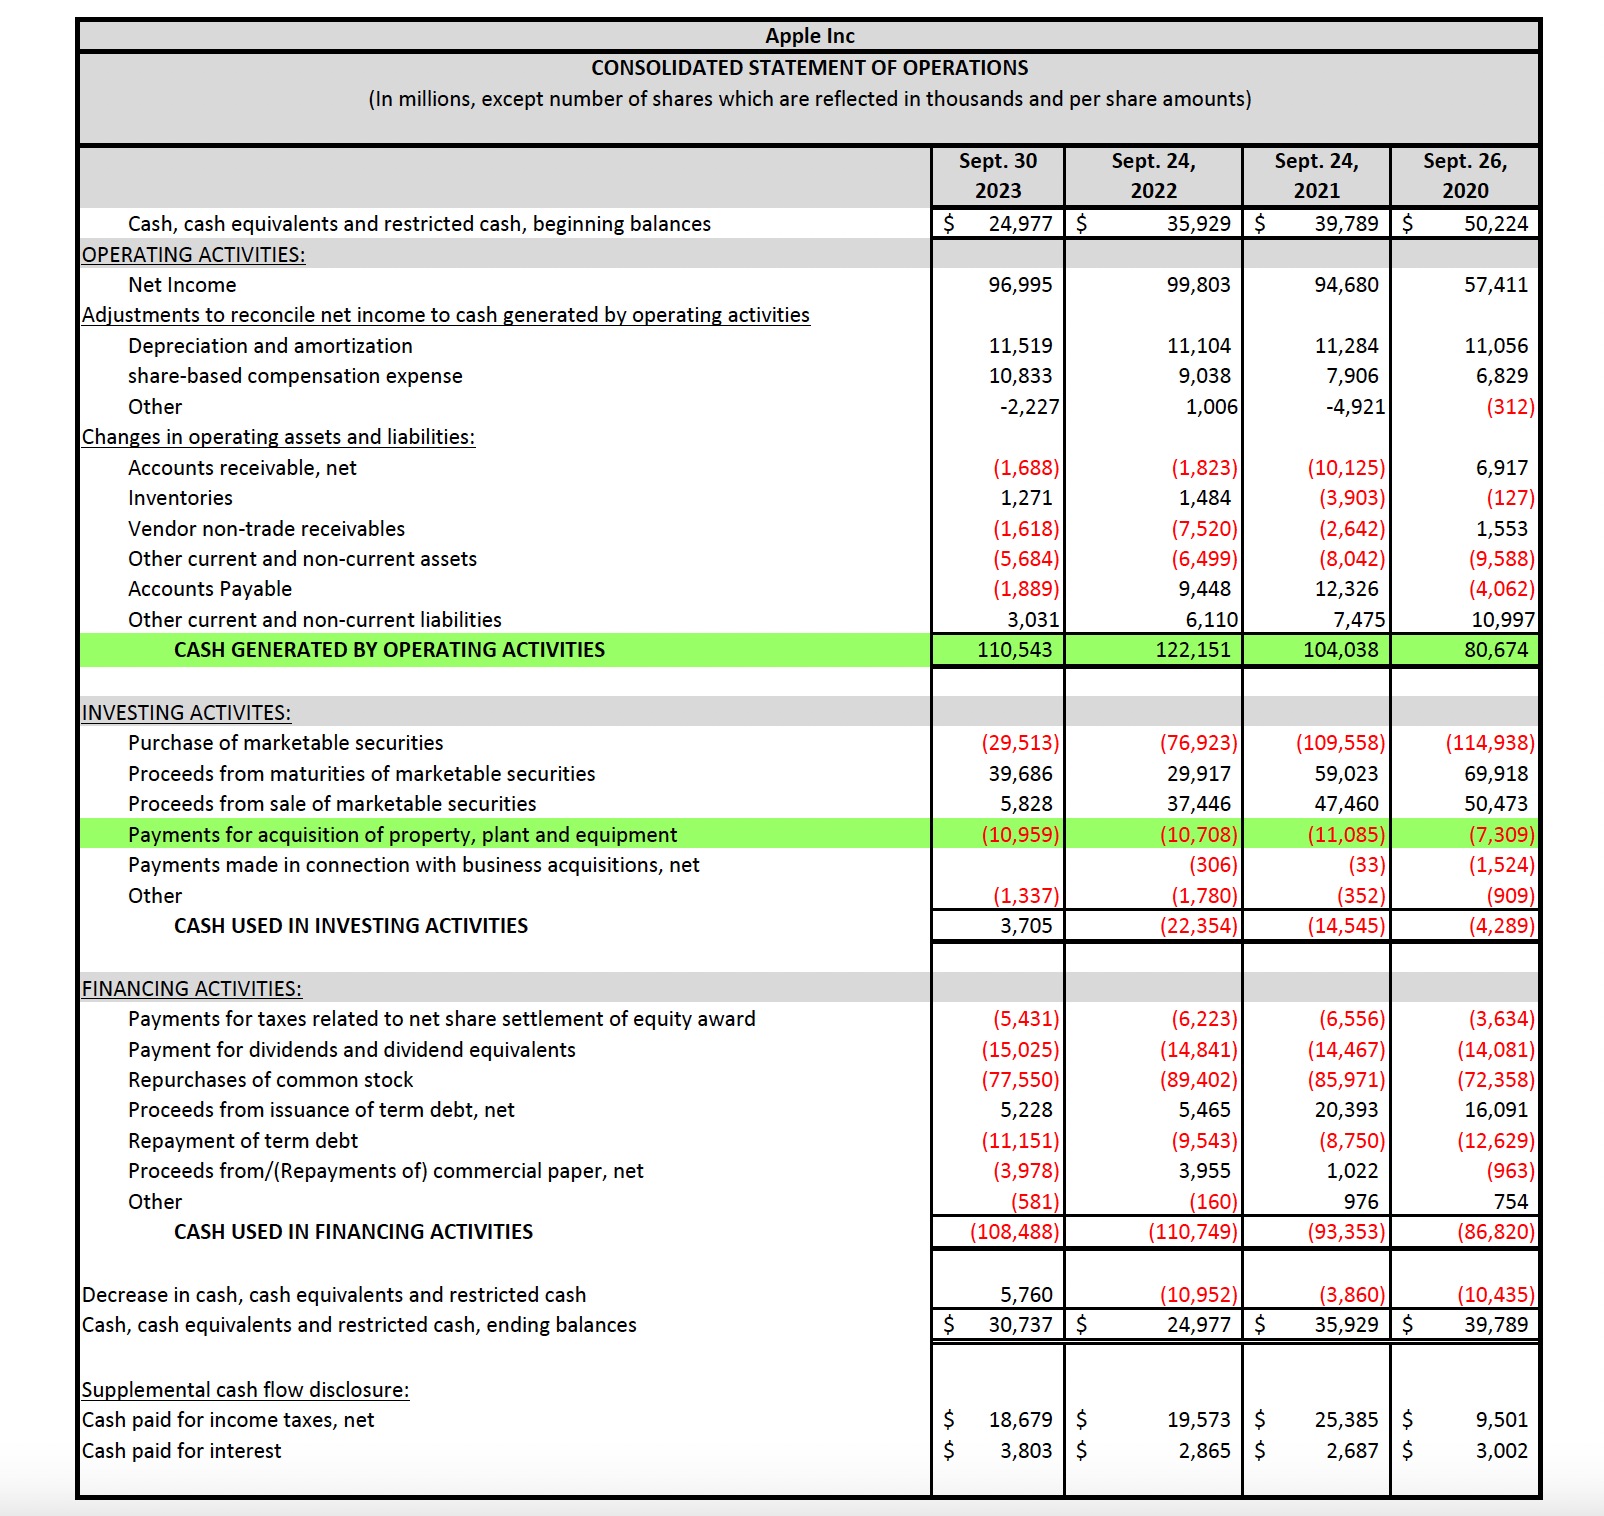
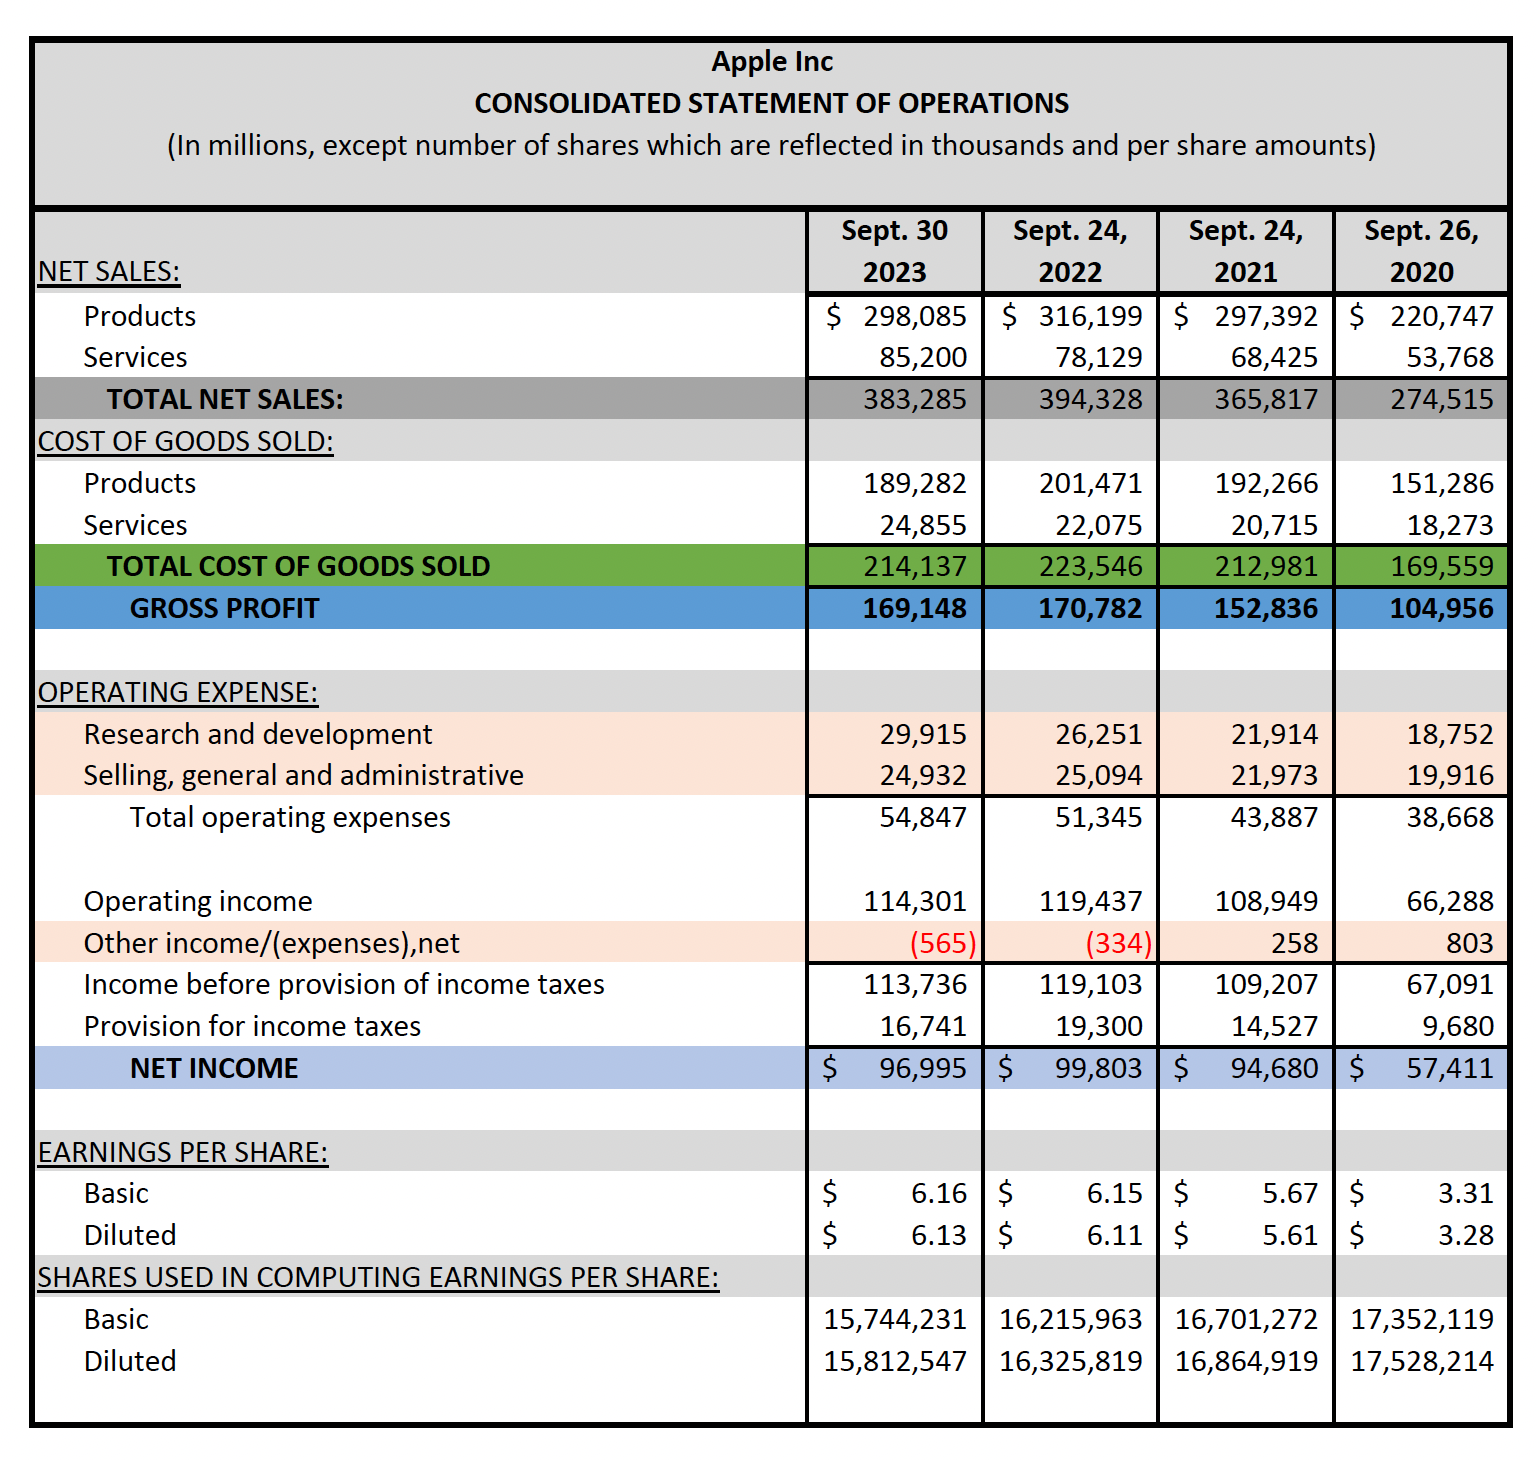
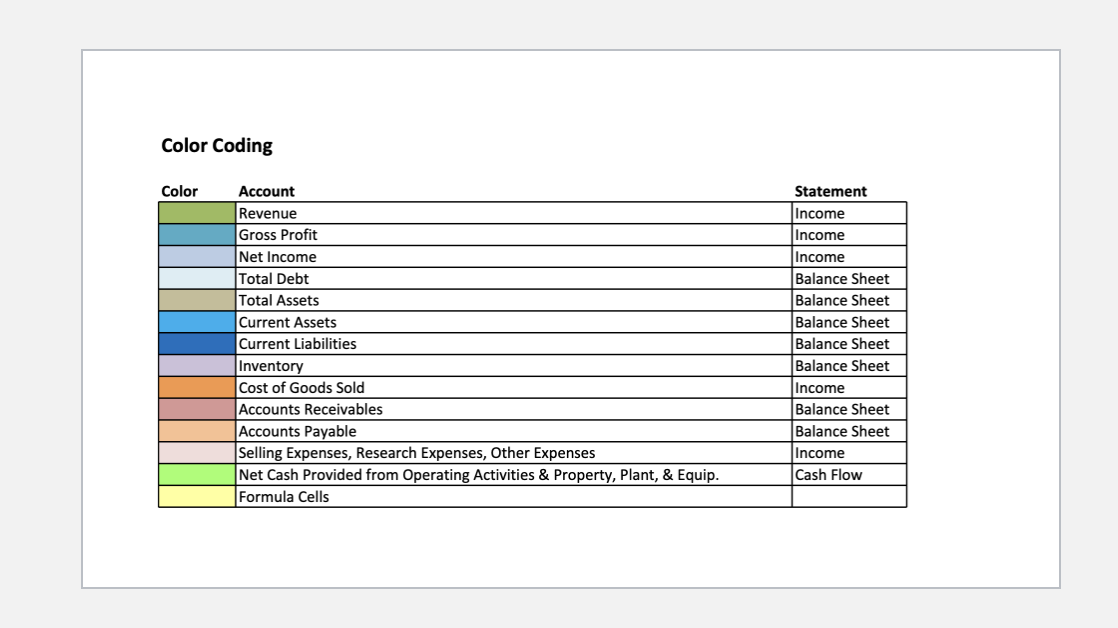
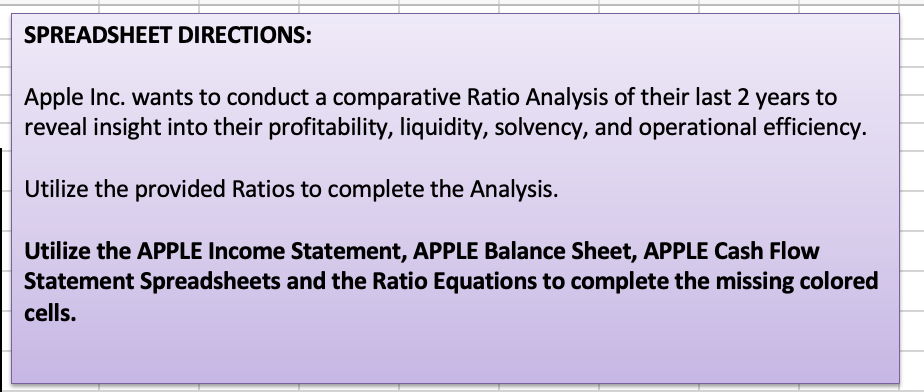
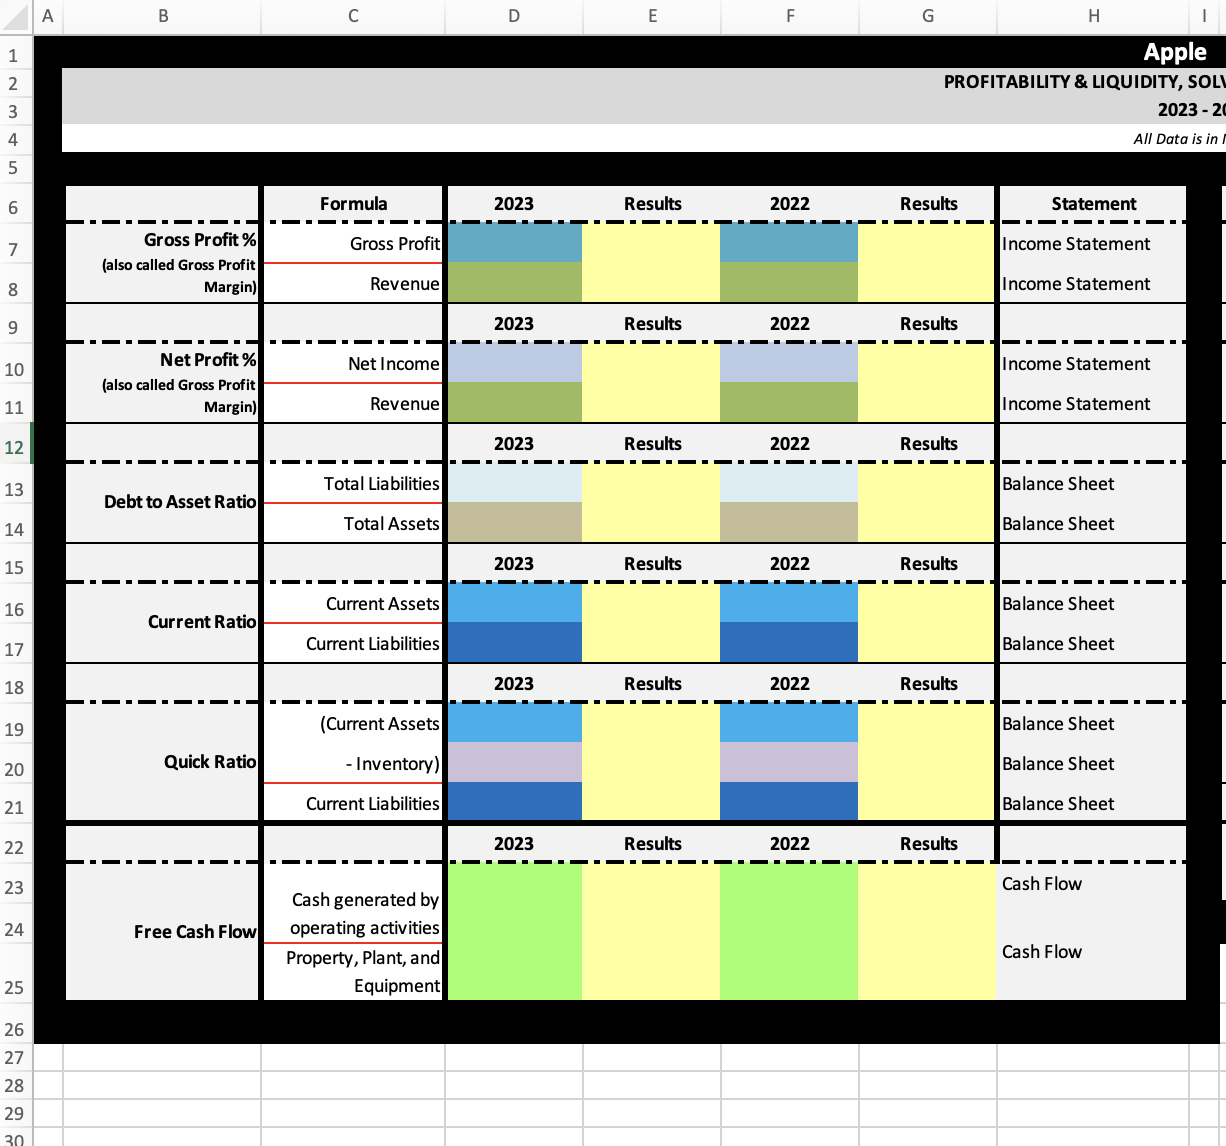
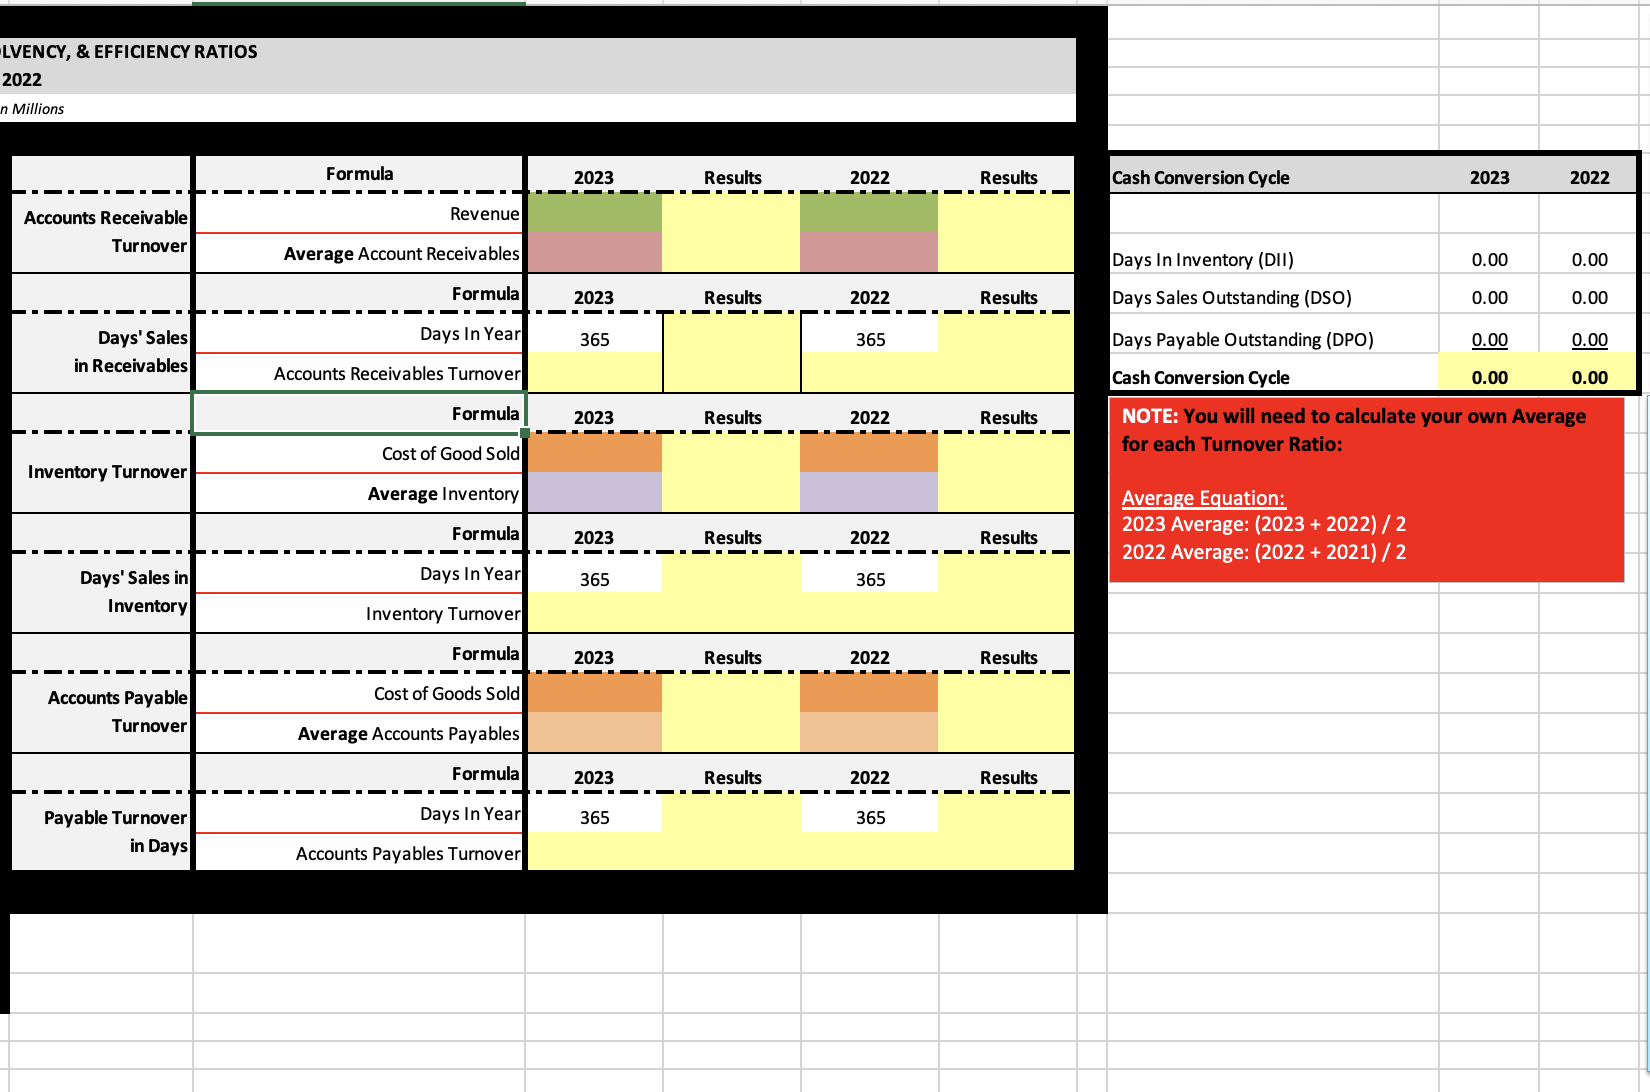
Apple Inc CONSOLIDATED BALANCE SHEET (In millions, except number of shares which are reflected in thousands and per share amounts) CURRENT ASSETS: Cash and cash equivalents Marketable securities Accounts receivable, net Inventories Vendor non-trade receivables Other current assets NON-CURRENT ASSETS Marketable securities 120,805 127,877 100,887 Property, plant and equipment, net 42,117 39,440 36,766 Other non-current assets 54,428 48,849 42,522 TOTAL NON-CURRENT ASSETS 209,017 217,350 216,166 180,175 TOTAL ASSETS 5 352,583 | S 352,755 [ $ 351,002 | $ 323,888 LIABILITIES AND SHAREHOLDERS' EQUITY CURRENT LIABILITIES Accounts Payable Other current liabilities Deferred revenue Commercial paper Term debt NON-CURRENT LIABILITIES Term Debt 109,106 Other non-current liabilities 53,325 TOTAL NON-CURRENT LIABILITIES 145,129 148,101 162,431 153,157 TOTAL LIABILITIES 290,437 302,083 287,912 258,549 COMMITMENTS AND CONTINGENCIES SHAREHOLDERS EQUITY Common stock and additional paid-in capital, 0.00001 par value 50,400,000 Shares authorized; 15,943,425 and 16,426,786 shares issued and outstanding, respectively 64,849 57,365 Retained earnings/(Accumulated deficit) (3,068) 5,562 Accumulated other comprehensive income/(loss) (11,109) 1 63 TOTAL SHAREHOLDERS EQUITY 62,146 50,672 63,090 65,339 TOTAL LIABILITIES AND SHAREHOLDERS' EQUITY S 352,583 | S ESNEE 351,002 | $ 323,888 Apple Inc CONSOLIDATED STATEMENT OF OPERATIONS (In millions, except number of shares which are reflected in thousands and per share amounts) Sept. 30 Sept. 24, Sept. 24, Sept. 26, 2023 2022 2021 2020 Cash, cash equivalents and restricted cash, beginning balances S 24977165 35,929 (S 39,789 | S 50,224 OPERATING ACTIVITIES: Net Income 96,995 99,803 94,680 57,411 Adjustments to reconcile net income to cash generated by operating activities Depreciation and amortization 11,519 11,104 11,284 11,056 share-based compensation expense 10,833 9,038 7,906 6,829 Other -2,227 1,006 -4,921 (312) Changes in operating assets and liabilities: Accounts receivable, net (1,823) (10,125) 6,917 Inventories 1,484 (3,903) (127) Vendor non-trade receivables (7,520) (2,642) 1,553 Other current and non-current assets (6,499) (8,042) (9,588) Accounts Payable 9,448 12,326 (4,062) Other current and non-current liabilities 6,110 7,475 10,997 CASH GENERATED BY OPERATING ACTIVITIES 110,543 122,151 104,038 80,674 INVESTING ACTIVITES: Purchase of marketable securities (76,923) (109,558 (114,938) Proceeds from maturities of marketable securities 39,686 29,917 59,023 69,918 Proceeds from sale of marketable securities 5,828 37,446 47,460 Payments for acquisition of property, plant and equipment (10,959) (10,708) (11,085 Payments made in connection with business acquisitions, net (306) (33) Other (1,337) (1,780) (352) CASH USED IN INVESTING ACTIVITIES 3,705 (22,354) (14,545 (4,289) FINANCING ACTIVITIES: Payments for taxes related to net share settlement of equity award (6,223) (6,556 (3,634) Payment for dividends and dividend equivalents (14,841) (14,467 (14,081) Repurchases of common stock (89,402) (85,971 (72,358) Proceeds from issuance of term debt, net 5,465 20,393 16,091 Repayment of term debt (9,543) (8,750 (12,629) Proceeds from/(Repayments of) commercial paper, net 3,955 1,022 (963) Other (160) 976 754 CASH USED IN FINANCING ACTIVITIES (108,488) (110,749 (93,353 (86,820) Decrease in cash, cash equivalents and restricted cash 5,760 (10,952 (3,860 (10,435) Cash, cash equivalents and restricted cash, ending balances S 30,737 1S 24,9771 S 35929 | S 39,789 Supplemental cash flow disclosure: Cash paid for income taxes, net S 18,6795 19,573 | $ 25,385 | S 9,501 Cash paid for interest S 2,865 | S 2,687 | S 3,002 ) ) Apple Inc CONSOLIDATED STATEMENT OF OPERATIONS (In millions, except number of shares which are reflected in thousands and per share amounts) Sept. 30 Sept. 24, Sept. 24, Sept. 26, Products S 298,085 | S 316,199 | S 297,392 | S 220,747 TOTAL NET SALES: 383,285 394,328 365,817 274,515 COST OF GOODS SOLD: Products 189,282 201,471 192,266 151,286 Services 24,855 22,075 20,715 18,273 TOTAL COST OF GOODS SOLD 214,137 223,546 212,981 169,559 GROSS PROFIT 169,148 170,782 152,836 104,956 OPERATING EXPENSE: Research and development 29,915 26,251 21,914 18,752 Selling, general and administrative 24,932 25,094 21,973 19,916 Total operating expenses 54,847 51,345 43,887 Operating income 114,301 119,437 108,949 Other income/(expenses),net (565) (334) Income before provision of income taxes 113,736 119,103 109,207 67,091 Provision for income taxes NET INCOME 96995 S 99803 S 94680 S 57411 EARNINGS PER SHARE: Basic 6.16 6.15 Diluted 6.13 6.11 SHARES USED IN COMPUTING EARNINGS PER SHARE: Basic 15,744,231 | 16,215,963 | 16,701,272 | 17,352,119 Diluted 15,812,547 | 16,325,819 | 16,864,919 | 17,528,214 Color Coding Color Account Statement Revenue Income Gross Profit Income Net Income Income Total Debt Balance Sheet Total Assets Balance Sheet Current Assets Balance Sheet Current Liabilities Balance Sheet Inventory Balance Sheet Cost of Goods Sold Income Accounts Receivables Balance Sheet Accounts Payable Balance Sheet Selling Expenses, Research Expenses, Other Expenses Income Net Cash Provided from Operating Activities & Property, Plant, & Equip. Cash Flow Formula CellsSPREADSHEET DIRECTIONS: Apple Inc. wants to conduct a comparative Ratio Analysis of their last 2 years to reveal insight into their profitability, liquidity, solvency, and operational efficiency. Utilize the provided Ratios to complete the Analysis. Utilize the APPLE Income Statement, APPLE Balance Sheet, APPLE Cash Flow Statement Spreadsheets and the Ratio Equations to complete the missing colored cells. 28 29 an Formula (also called Gross Profit (also called Gross Profit Margin) (Current Assets Current Liabilities Cash generated by Free CashFlow] operating activities Property, Plant, and Equipment PROFITABILITY & LIQUIDITY, SOL\\ Results 2023 Results 2022 Results 2023 - 2( All Data is in | Statement Income Statement Income Statement Income Statement Income Statement Balance Sheet Balance Sheet Balance Sheet Balance Sheet Balance Sheet Balance Sheet Balance Sheet Cash Flow Cash Flow LVENCY, & EFFICIENCY RATIOS 202 n Millions Formula 2023 Results 2022 Results Cash Conversion Cycle 2023 2022 - - Accounts Receivable Revenue Turnover Average Account Receivable Days In Inventory (DII) 0.00 0.00 Formula 2023 Results 2022 Results Days Sales Outstanding (DSO) 0.00 0.00 - -. Days' Sales Days In Year 365 365 Days Payable Outstanding (DPO) 0.00 0.00 in Receivables Accounts Receivables Turnover Cash Conversion Cycle 0.00 0.00 Formula 2023 Results 2022 Results NOTE: You will need to calculate your own Average for each Turnover Ratio: Cost of Good Sold Inventory Turnover Average Inventory Average Equation: 2023 Average: (2023 + 2022) / 2 Formula 2023 Results 2022 Results 2022 Average: (2022 + 2021) / 2 Days' Sales in Days In Year 365 365 Inventory Inventory Turnover Formula 2023 Results 2022 Results - - Accounts Payable Cost of Goods Sold Turnover Average Accounts Payables Formula 2023 Results 2022 Results - - Payable Turnover Days In Year 365 365 in Days Accounts Payables Turnover
Step by Step Solution
There are 3 Steps involved in it

Get step-by-step solutions from verified subject matter experts