Question: ** Fill in the blank cells per question 2 CAUSES EFFECT ISSUE 1 Defect ISSUE 2 OPM400 Assignment #2 mtin Central University Food Service Analysis
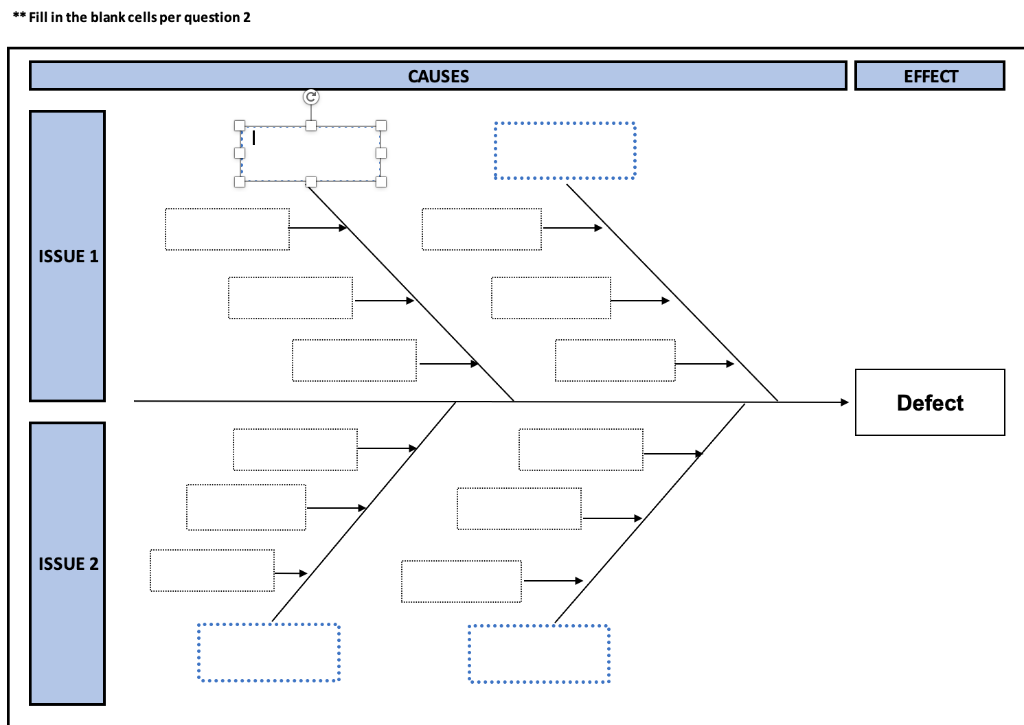
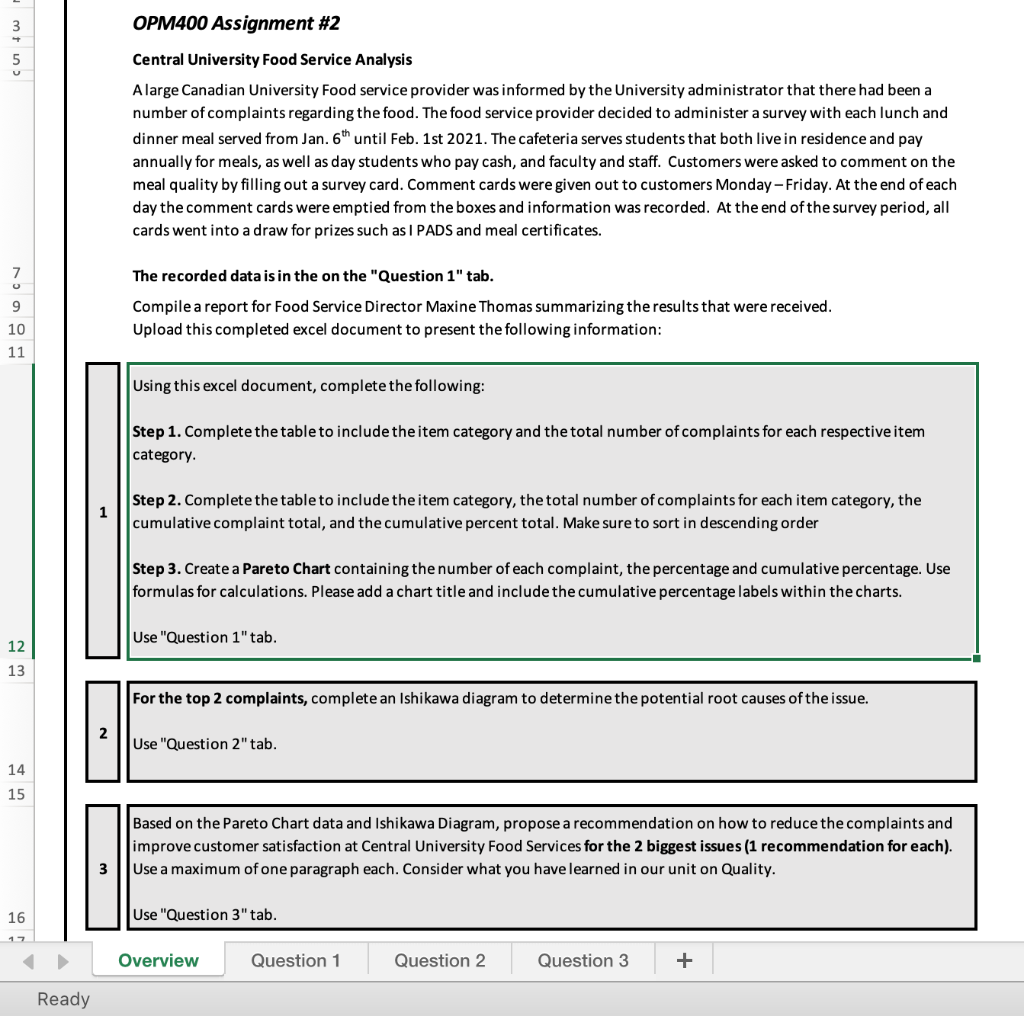
** Fill in the blank cells per question 2 CAUSES EFFECT ISSUE 1 Defect ISSUE 2 OPM400 Assignment #2 mtin Central University Food Service Analysis A large Canadian University Food service provider was informed by the University administrator that there had been a number of complaints regarding the food. The food service provider decided to administer a survey with each lunch and dinner meal served from Jan. 6th until Feb. 1st 2021. The cafeteria serves students that both live in residence and pay annually for meals, as well as day students who pay cash, and faculty and staff. Customers were asked to comment on the meal quality by filling out a survey card. Comment cards were given out to customers Monday - Friday. At the end of each day the comment cards were emptied from the boxes and information was recorded. At the end of the survey period, all cards went into a draw for prizes such as I PADS and meal certificates. The recorded data is in the on the "Question 1" tab. 9 10 11 Compile a report for Food Service Director Maxine Thomas summarizing the results that were received. Upload this completed excel document to present the following information: Using this excel document, complete the following: Step 1. Complete the table to include the item category and the total number of complaints for each respective item category 1 Step 2. Complete the table to include the item category, the total number of complaints for each item category, the cumulative complaint total, and the cumulative percent total. Make sure to sort in descending order Step 3. Create a Pareto Chart containing the number of each complaint, the percentage and cumulative percentage. Use formulas for calculations. Please add a chart title and include the cumulative percentage labels within the charts. Use "Question 1" tab. 12 13 For the top 2 complaints, complete an Ishikawa diagram to determine the potential root causes of the issue. Use "Question 2" tab. 14 15 Based on the Pareto Chart data and Ishikawa Diagram, propose a recommendation on how to reduce the complaints and improve customer satisfaction at Central University Food Services for the 2 biggest issues (1 recommendation for each). Use a maximum of one paragraph each. Consider what you have learned in our unit on Quality. 3 16 Use "Question 3" tab. 17 Overview Question 1 Question 2 Question 3 + Ready ** Fill in the blank cells per question 2 CAUSES EFFECT ISSUE 1 Defect ISSUE 2 OPM400 Assignment #2 mtin Central University Food Service Analysis A large Canadian University Food service provider was informed by the University administrator that there had been a number of complaints regarding the food. The food service provider decided to administer a survey with each lunch and dinner meal served from Jan. 6th until Feb. 1st 2021. The cafeteria serves students that both live in residence and pay annually for meals, as well as day students who pay cash, and faculty and staff. Customers were asked to comment on the meal quality by filling out a survey card. Comment cards were given out to customers Monday - Friday. At the end of each day the comment cards were emptied from the boxes and information was recorded. At the end of the survey period, all cards went into a draw for prizes such as I PADS and meal certificates. The recorded data is in the on the "Question 1" tab. 9 10 11 Compile a report for Food Service Director Maxine Thomas summarizing the results that were received. Upload this completed excel document to present the following information: Using this excel document, complete the following: Step 1. Complete the table to include the item category and the total number of complaints for each respective item category 1 Step 2. Complete the table to include the item category, the total number of complaints for each item category, the cumulative complaint total, and the cumulative percent total. Make sure to sort in descending order Step 3. Create a Pareto Chart containing the number of each complaint, the percentage and cumulative percentage. Use formulas for calculations. Please add a chart title and include the cumulative percentage labels within the charts. Use "Question 1" tab. 12 13 For the top 2 complaints, complete an Ishikawa diagram to determine the potential root causes of the issue. Use "Question 2" tab. 14 15 Based on the Pareto Chart data and Ishikawa Diagram, propose a recommendation on how to reduce the complaints and improve customer satisfaction at Central University Food Services for the 2 biggest issues (1 recommendation for each). Use a maximum of one paragraph each. Consider what you have learned in our unit on Quality. 3 16 Use "Question 3" tab. 17 Overview Question 1 Question 2 Question 3 + Ready


