

Question: Fill in the blanks a ) bar chart is a graphical method used to display and compare two qualitative variables. b ) The sum of
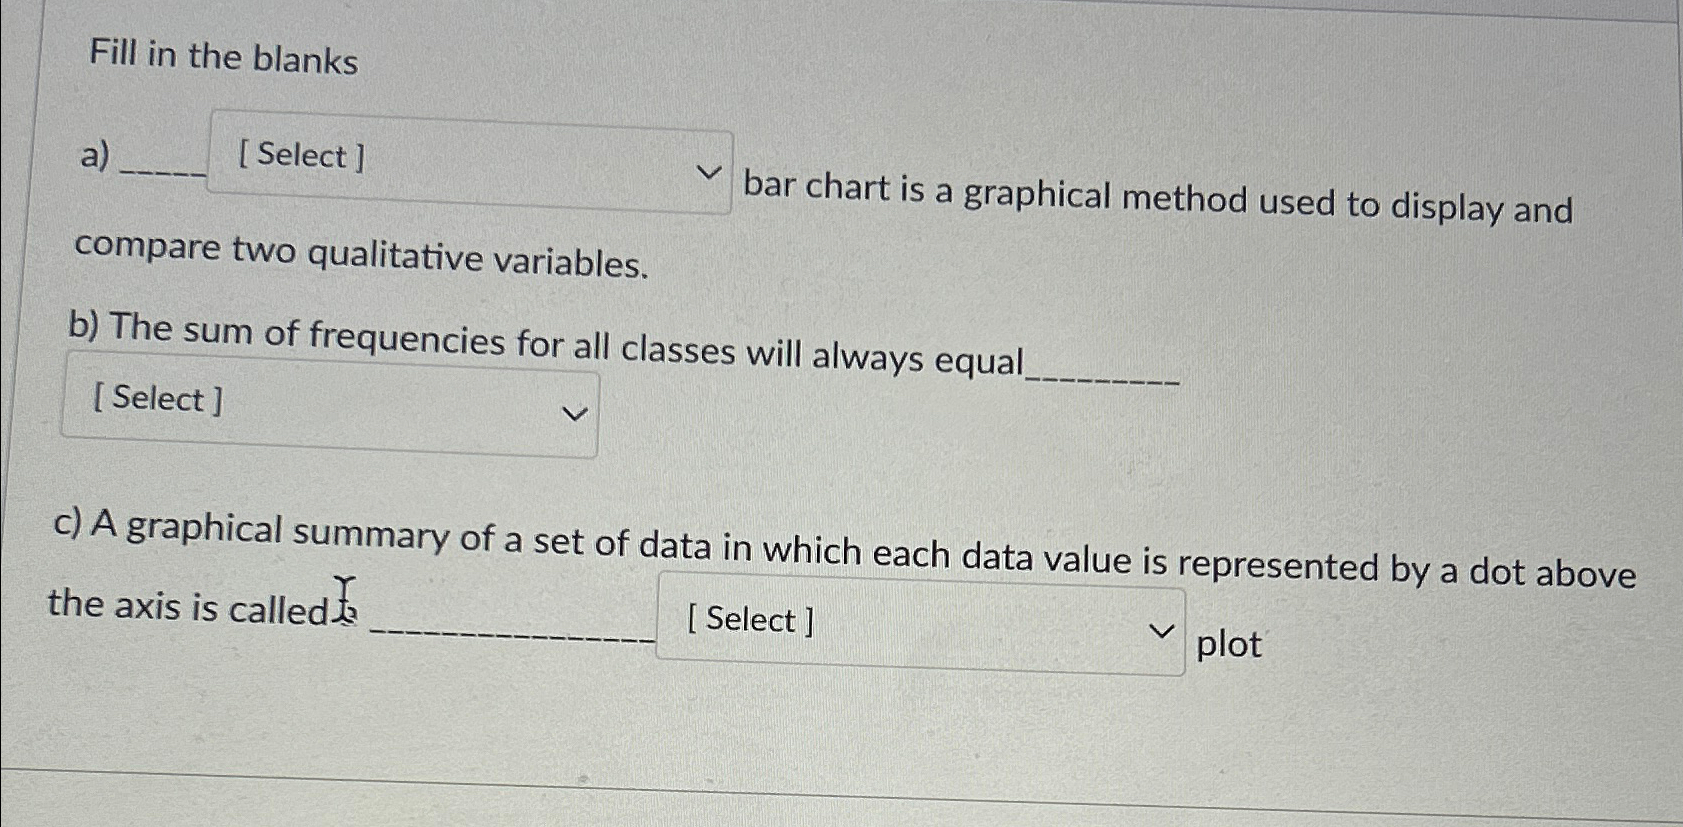
Fill in the blanks
a bar chart is a graphical method used to display and compare two qualitative variables.
b The sum of frequencies for all classes will always equal
c A graphical summary of a set of data in which each data value is represented by a dot above the axis is called plot
Step by Step Solution
There are 3 Steps involved in it
1 Expert Approved Answer
Step: 1 Unlock

Question Has Been Solved by an Expert!
Get step-by-step solutions from verified subject matter experts
Step: 2 Unlock
Step: 3 Unlock