

Question: fill in the blanks using the statements shown and formulate your answer into a percentage also show the equation and formula used. fill in the
fill in the blanks using the statements shown and formulate your answer into a percentage also show the equation and formula used.
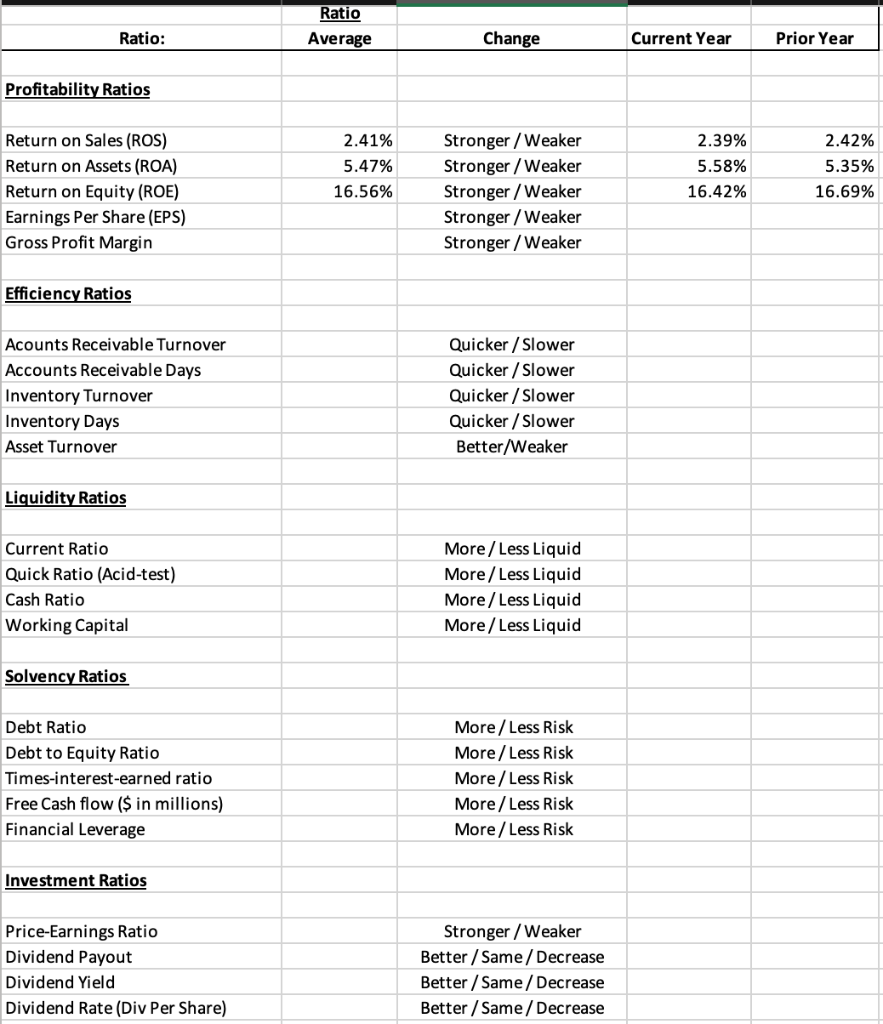
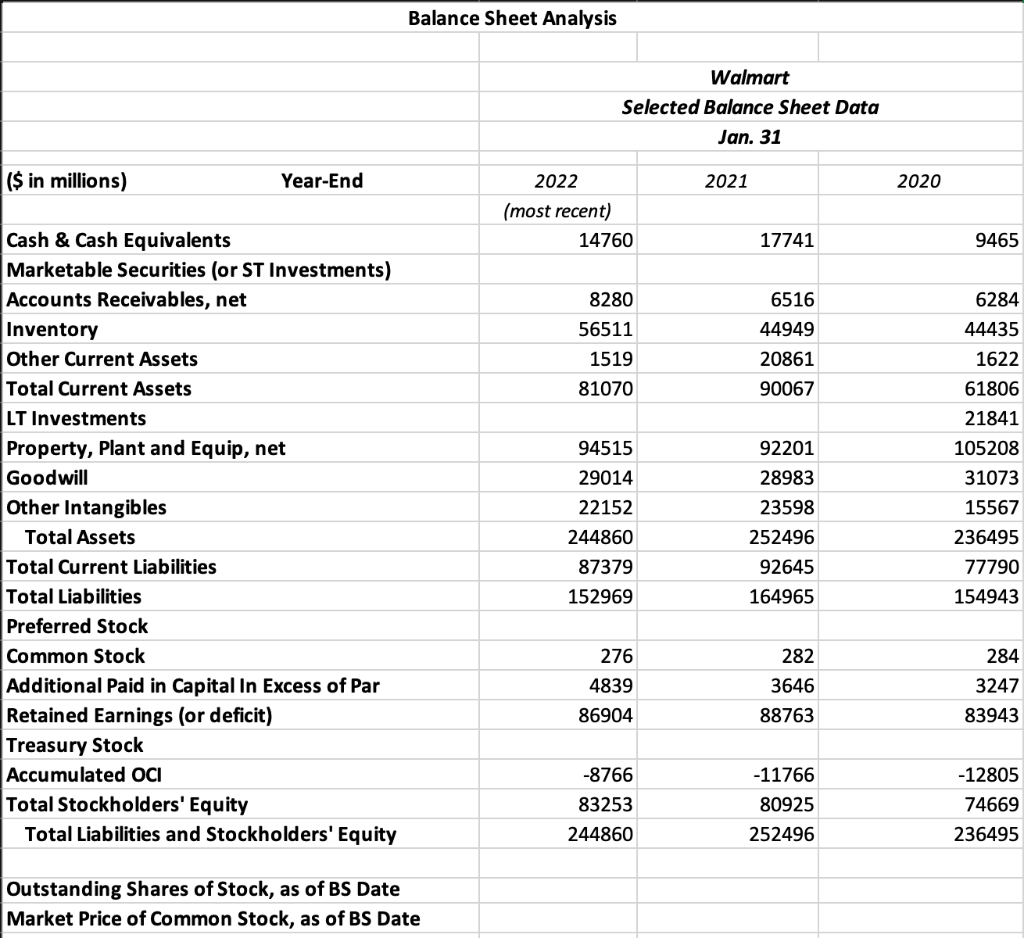
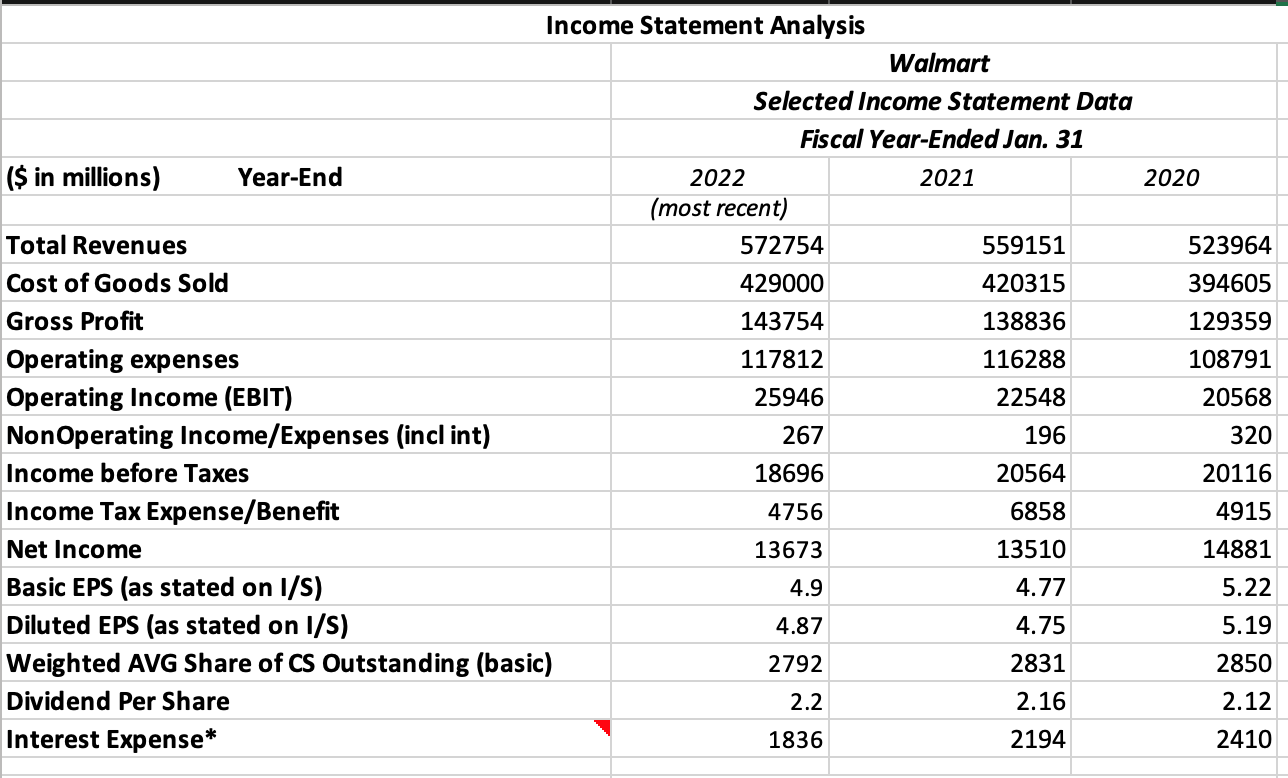
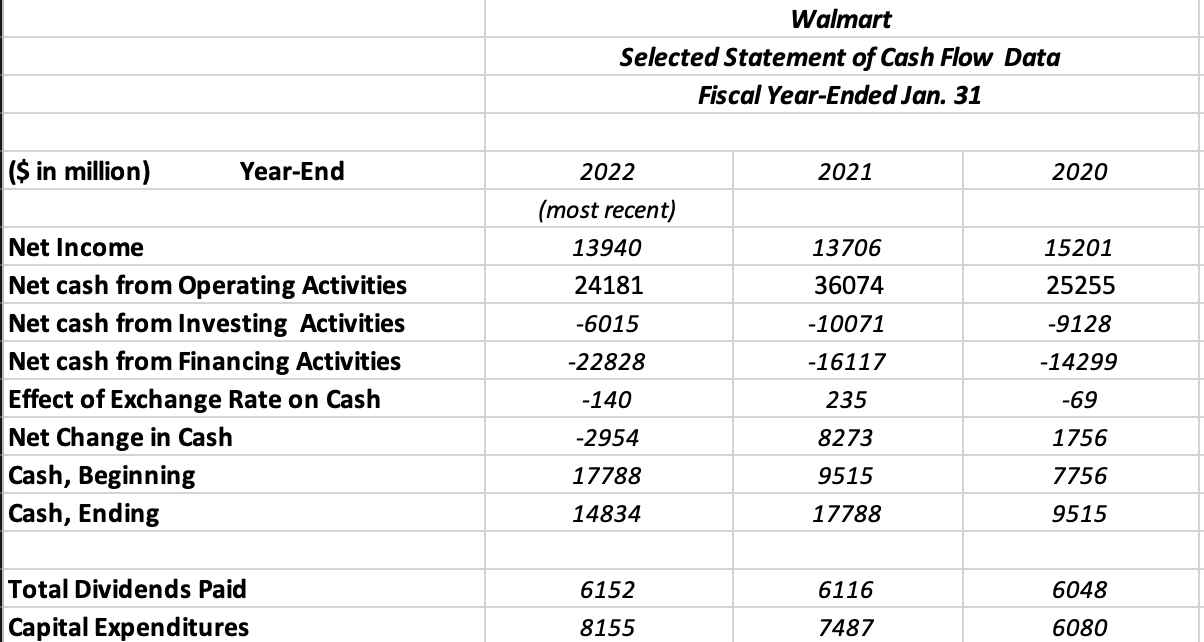
Ratio \begin{tabular}{c|cccc} Ratio: & Average & Change & Current Year & Prior Year \\ \hline \end{tabular} Profitability Ratios Efficiency Ratios Acounts Receivable Turnover Quicker / Slower Accounts Receivable Days Quicker / Slower Inventory Turnover Quicker / Slower Inventory Days Quicker / Slower Asset Turnover Better/Weaker Liquidity Ratios \begin{tabular}{l|l} \hline Current Ratio & More / Less Liquid \\ \hline Quick Ratio (Acid-test) & More / Less Liquid \\ \hline Cash Ratio & More / Less Liquid \\ \hline Working Capital & More / Less Liquid \\ \hline \end{tabular} Solvency Ratios \begin{tabular}{|l|l|} \hline Debt Ratio & More / Less Risk \\ \hline Debt to Equity Ratio & More / Less Risk \\ \hline Times-interest-earned ratio & More / Less Risk \\ \hline Free Cash flow (\$ in millions) & More / Less Risk \\ \hline Financial Leverage & More / Less Risk \\ \hline \end{tabular} Investment Ratios Price-Earnings Ratio Stronger / Weaker Dividend Payout Better / Same / Decrease Dividend Yield Better / Same / Decrease Dividend Rate (Div Per Share) Better / Same / Decrease Balance Sheet Analysis Outstanding Shares of Stock, as of BS Date Market Price of Common Stock, as of BS Date Income Statement Analysis Walmart Selected Income Statement Data Fiscal Year-Ended Jan. 31 Walmart Selected Statement of Cash Flow Data Fiscal Year-Ended Jan. 31 \begin{tabular}{|l|c|c|c|} \hline (\$ in million) & Year-End & 2022 & 2021 \\ \hline & (most recent) & & \\ \hline Net Income & 13940 & 13706 & 15201 \\ \hline Net cash from Operating Activities & 24181 & 36074 & 25255 \\ \hline Net cash from Investing Activities & -6015 & -10071 & -9128 \\ \hline Net cash from Financing Activities & -22828 & -16117 & -14299 \\ \hline Effect of Exchange Rate on Cash & -140 & 235 & -69 \\ \hline Net Change in Cash & -2954 & 8273 & 1756 \\ \hline Cash, Beginning & 17788 & 9515 & 7756 \\ \hline Cash, Ending & 14834 & 17788 & 9515 \\ \hline & & & \\ \hline Total Dividends Paid & 6152 & 6116 & 6048 \\ \hline Capital Expenditures & 8155 & 7487 & 6080 \\ \hline \end{tabular} Ratio \begin{tabular}{c|cccc} Ratio: & Average & Change & Current Year & Prior Year \\ \hline \end{tabular} Profitability Ratios Efficiency Ratios Acounts Receivable Turnover Quicker / Slower Accounts Receivable Days Quicker / Slower Inventory Turnover Quicker / Slower Inventory Days Quicker / Slower Asset Turnover Better/Weaker Liquidity Ratios \begin{tabular}{l|l} \hline Current Ratio & More / Less Liquid \\ \hline Quick Ratio (Acid-test) & More / Less Liquid \\ \hline Cash Ratio & More / Less Liquid \\ \hline Working Capital & More / Less Liquid \\ \hline \end{tabular} Solvency Ratios \begin{tabular}{|l|l|} \hline Debt Ratio & More / Less Risk \\ \hline Debt to Equity Ratio & More / Less Risk \\ \hline Times-interest-earned ratio & More / Less Risk \\ \hline Free Cash flow (\$ in millions) & More / Less Risk \\ \hline Financial Leverage & More / Less Risk \\ \hline \end{tabular} Investment Ratios Price-Earnings Ratio Stronger / Weaker Dividend Payout Better / Same / Decrease Dividend Yield Better / Same / Decrease Dividend Rate (Div Per Share) Better / Same / Decrease Balance Sheet Analysis Outstanding Shares of Stock, as of BS Date Market Price of Common Stock, as of BS Date Income Statement Analysis Walmart Selected Income Statement Data Fiscal Year-Ended Jan. 31 Walmart Selected Statement of Cash Flow Data Fiscal Year-Ended Jan. 31 \begin{tabular}{|l|c|c|c|} \hline (\$ in million) & Year-End & 2022 & 2021 \\ \hline & (most recent) & & \\ \hline Net Income & 13940 & 13706 & 15201 \\ \hline Net cash from Operating Activities & 24181 & 36074 & 25255 \\ \hline Net cash from Investing Activities & -6015 & -10071 & -9128 \\ \hline Net cash from Financing Activities & -22828 & -16117 & -14299 \\ \hline Effect of Exchange Rate on Cash & -140 & 235 & -69 \\ \hline Net Change in Cash & -2954 & 8273 & 1756 \\ \hline Cash, Beginning & 17788 & 9515 & 7756 \\ \hline Cash, Ending & 14834 & 17788 & 9515 \\ \hline & & & \\ \hline Total Dividends Paid & 6152 & 6116 & 6048 \\ \hline Capital Expenditures & 8155 & 7487 & 6080 \\ \hline \end{tabular}
Step by Step Solution
There are 3 Steps involved in it

Get step-by-step solutions from verified subject matter experts