

Question: Fill in the boxes as shown in the chart with the answers, please! Saved Required information The following information applies to the questions displayed below.
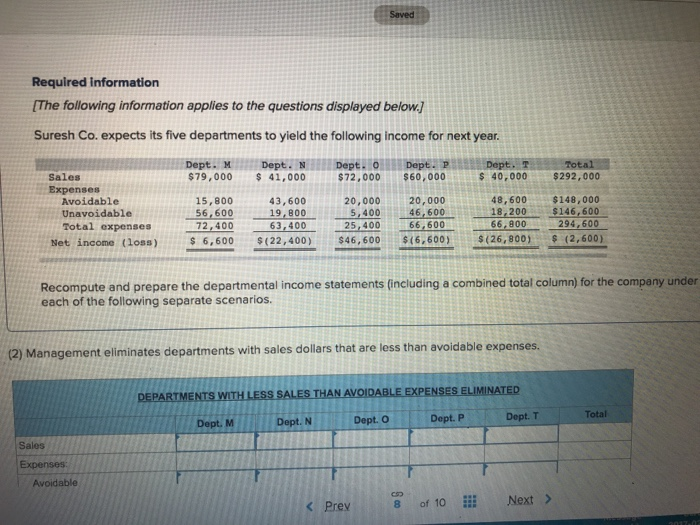
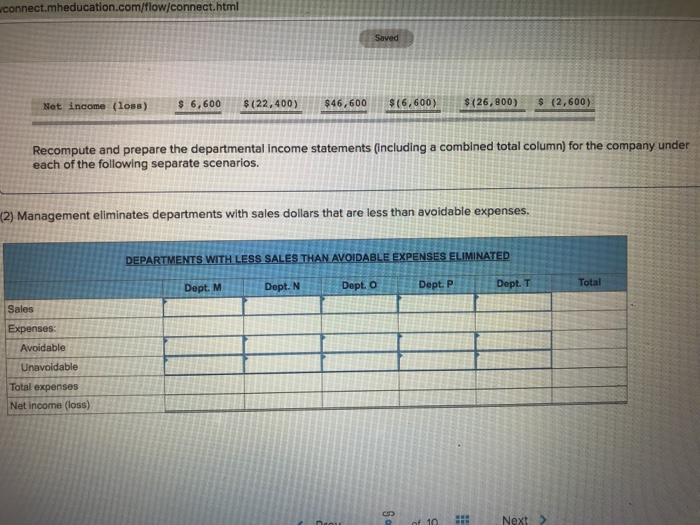
Saved Required information The following information applies to the questions displayed below. Suresh Co. expects its five departments to yield the following income for next year. s 41,000$72,000 $60,000 Sales Expenses s 40,000$292,000 43,600 56,60019,800 Total expenses72 400 63,400 20,000 20,000 25,40066 $46,600-6,600- 48,600$148,000 5,400 46,60018,200 $146,600 66,60066 800 294,600 15,800 Avoidable Unavoidable (loss) -600-2,400- 6,800--(2,6001 Net income Recompute and prepare the departmental income statements (including a combined total column) for the company under each of the following separate scenarios (2) Management eliminates departments with sales dollars that are less than avoidable expenses DEPARTMENTS WITH LESS SALES THAN AVOIDABLE EXPENSES ELIMINATED Total Dept. M Dept. N Dept. O Dept. P Dept. T Sales Expenses Avoidable
Step by Step Solution
There are 3 Steps involved in it

Get step-by-step solutions from verified subject matter experts