Question: fill in the missing column based on the last two pictures AutoSave A AF ? C ... Lecture 2 - Financial Statements Example Lecture (With
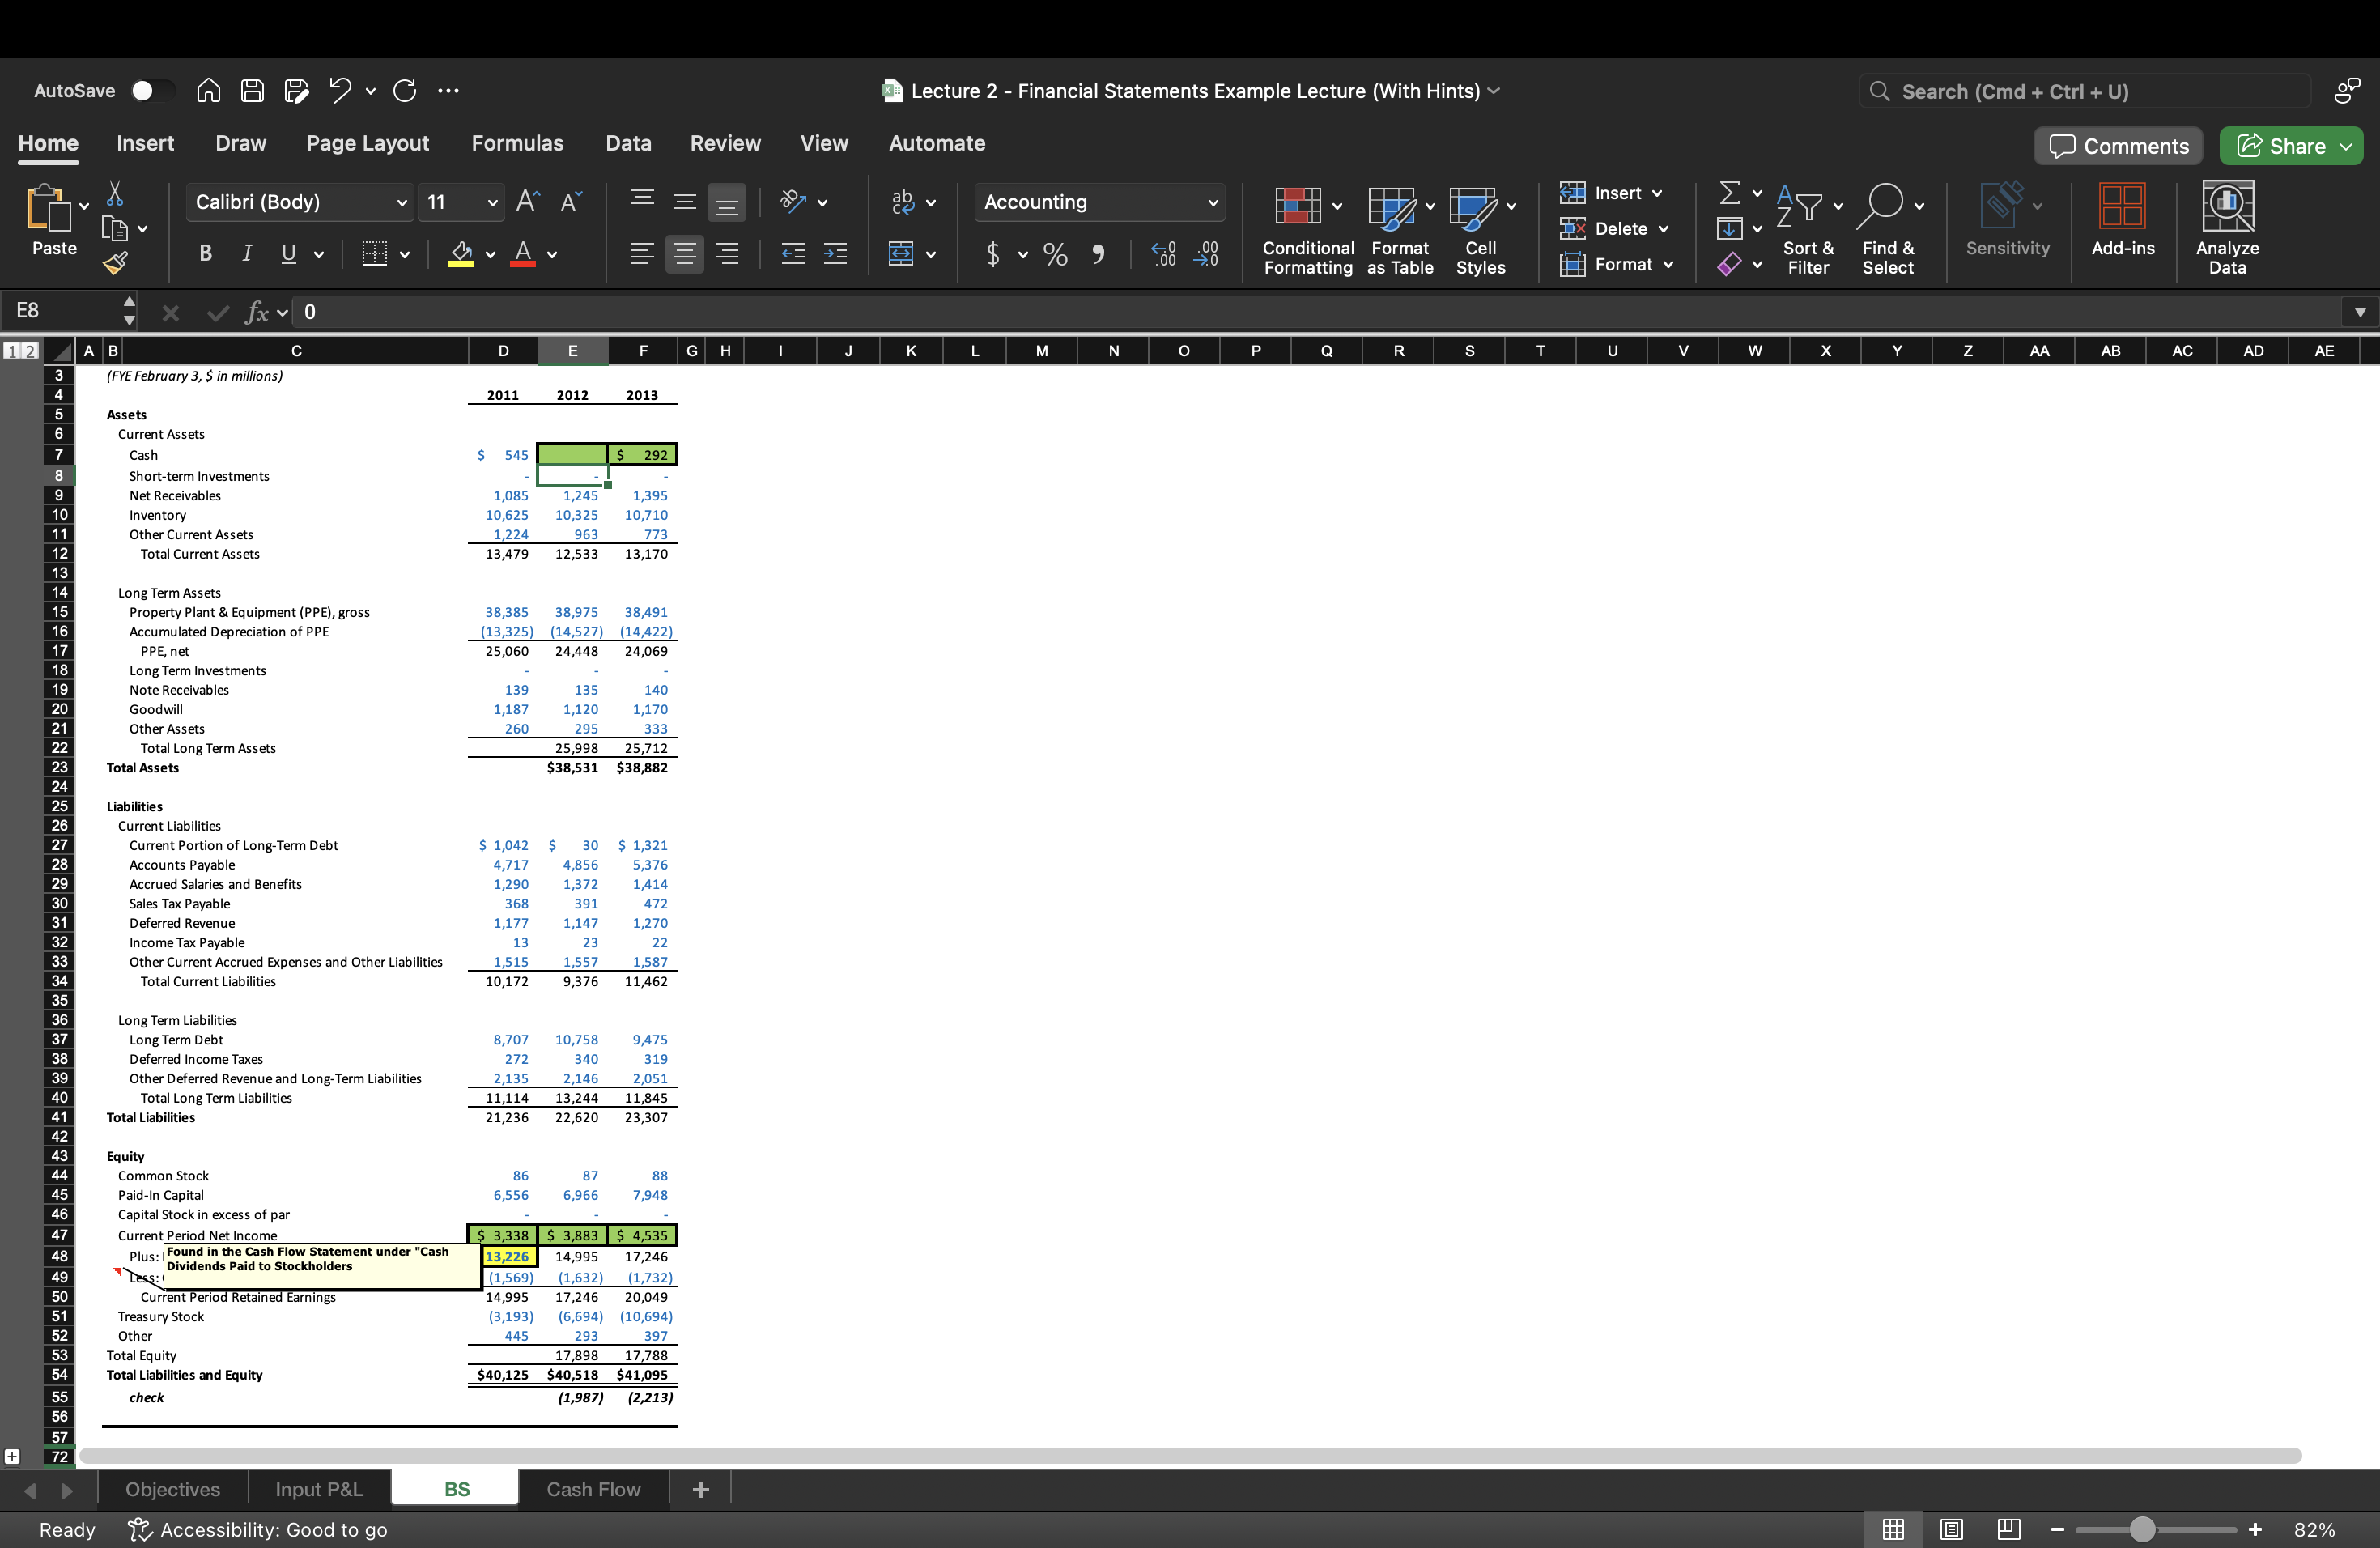
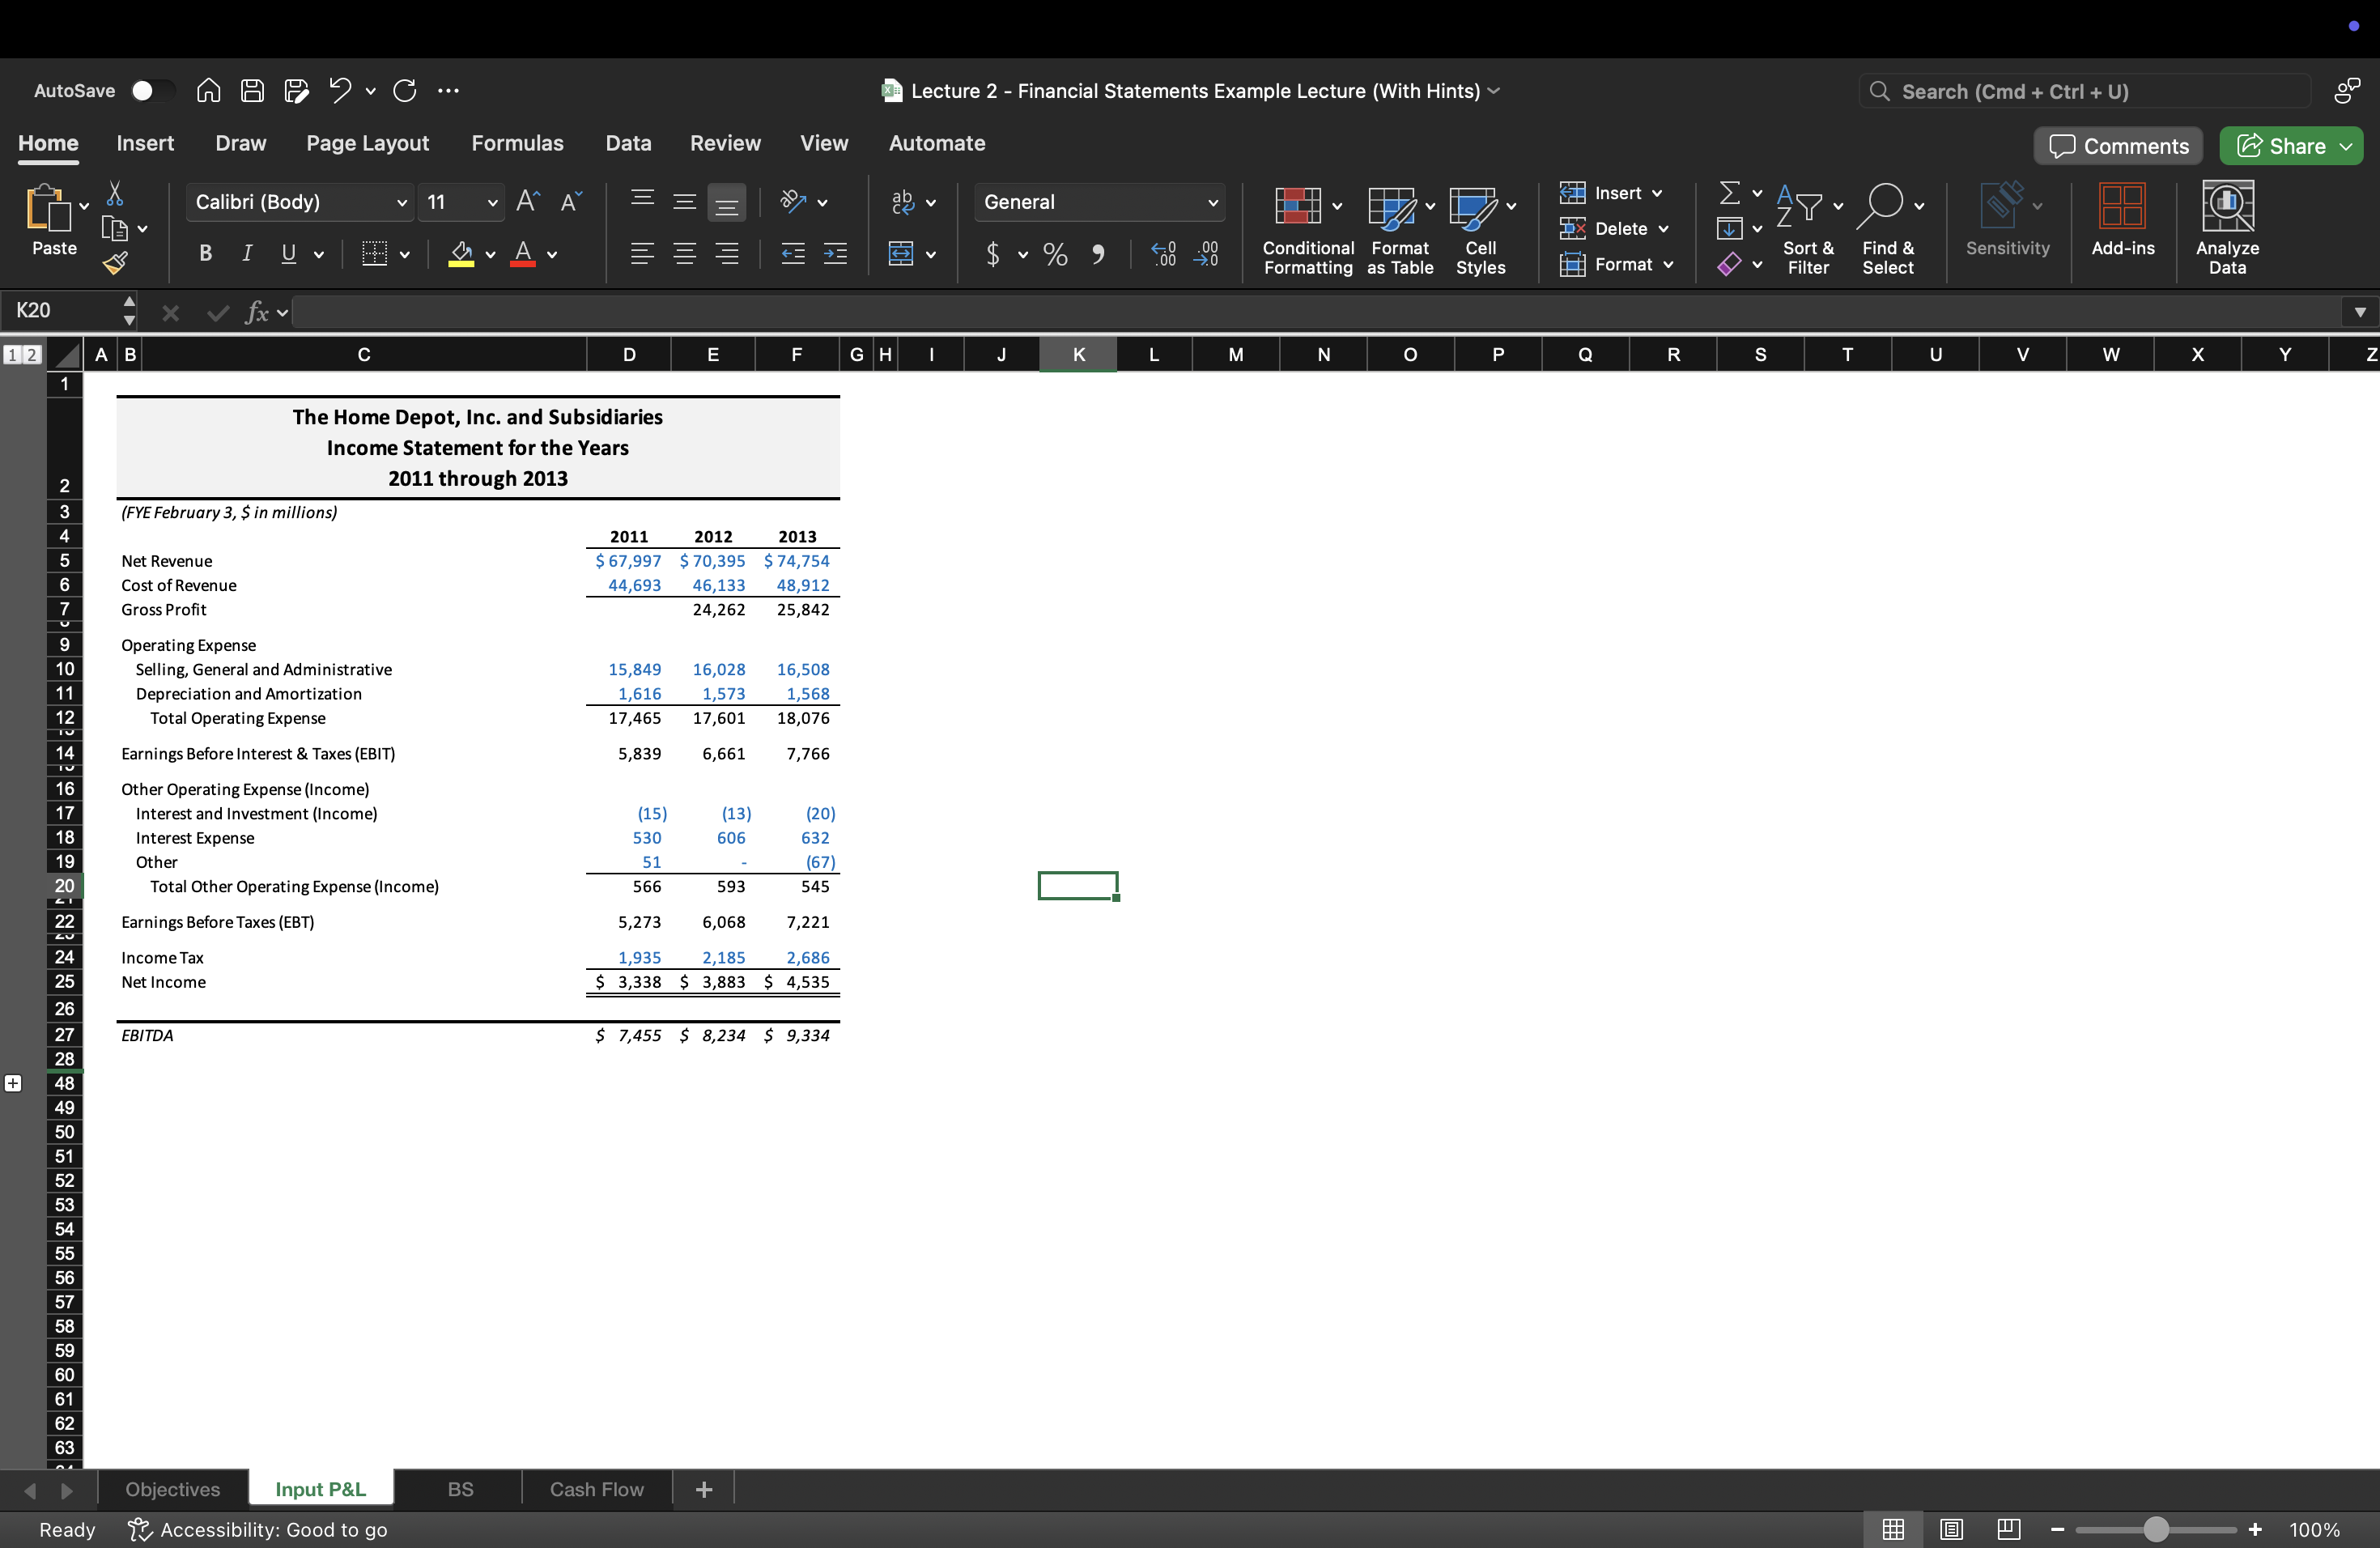
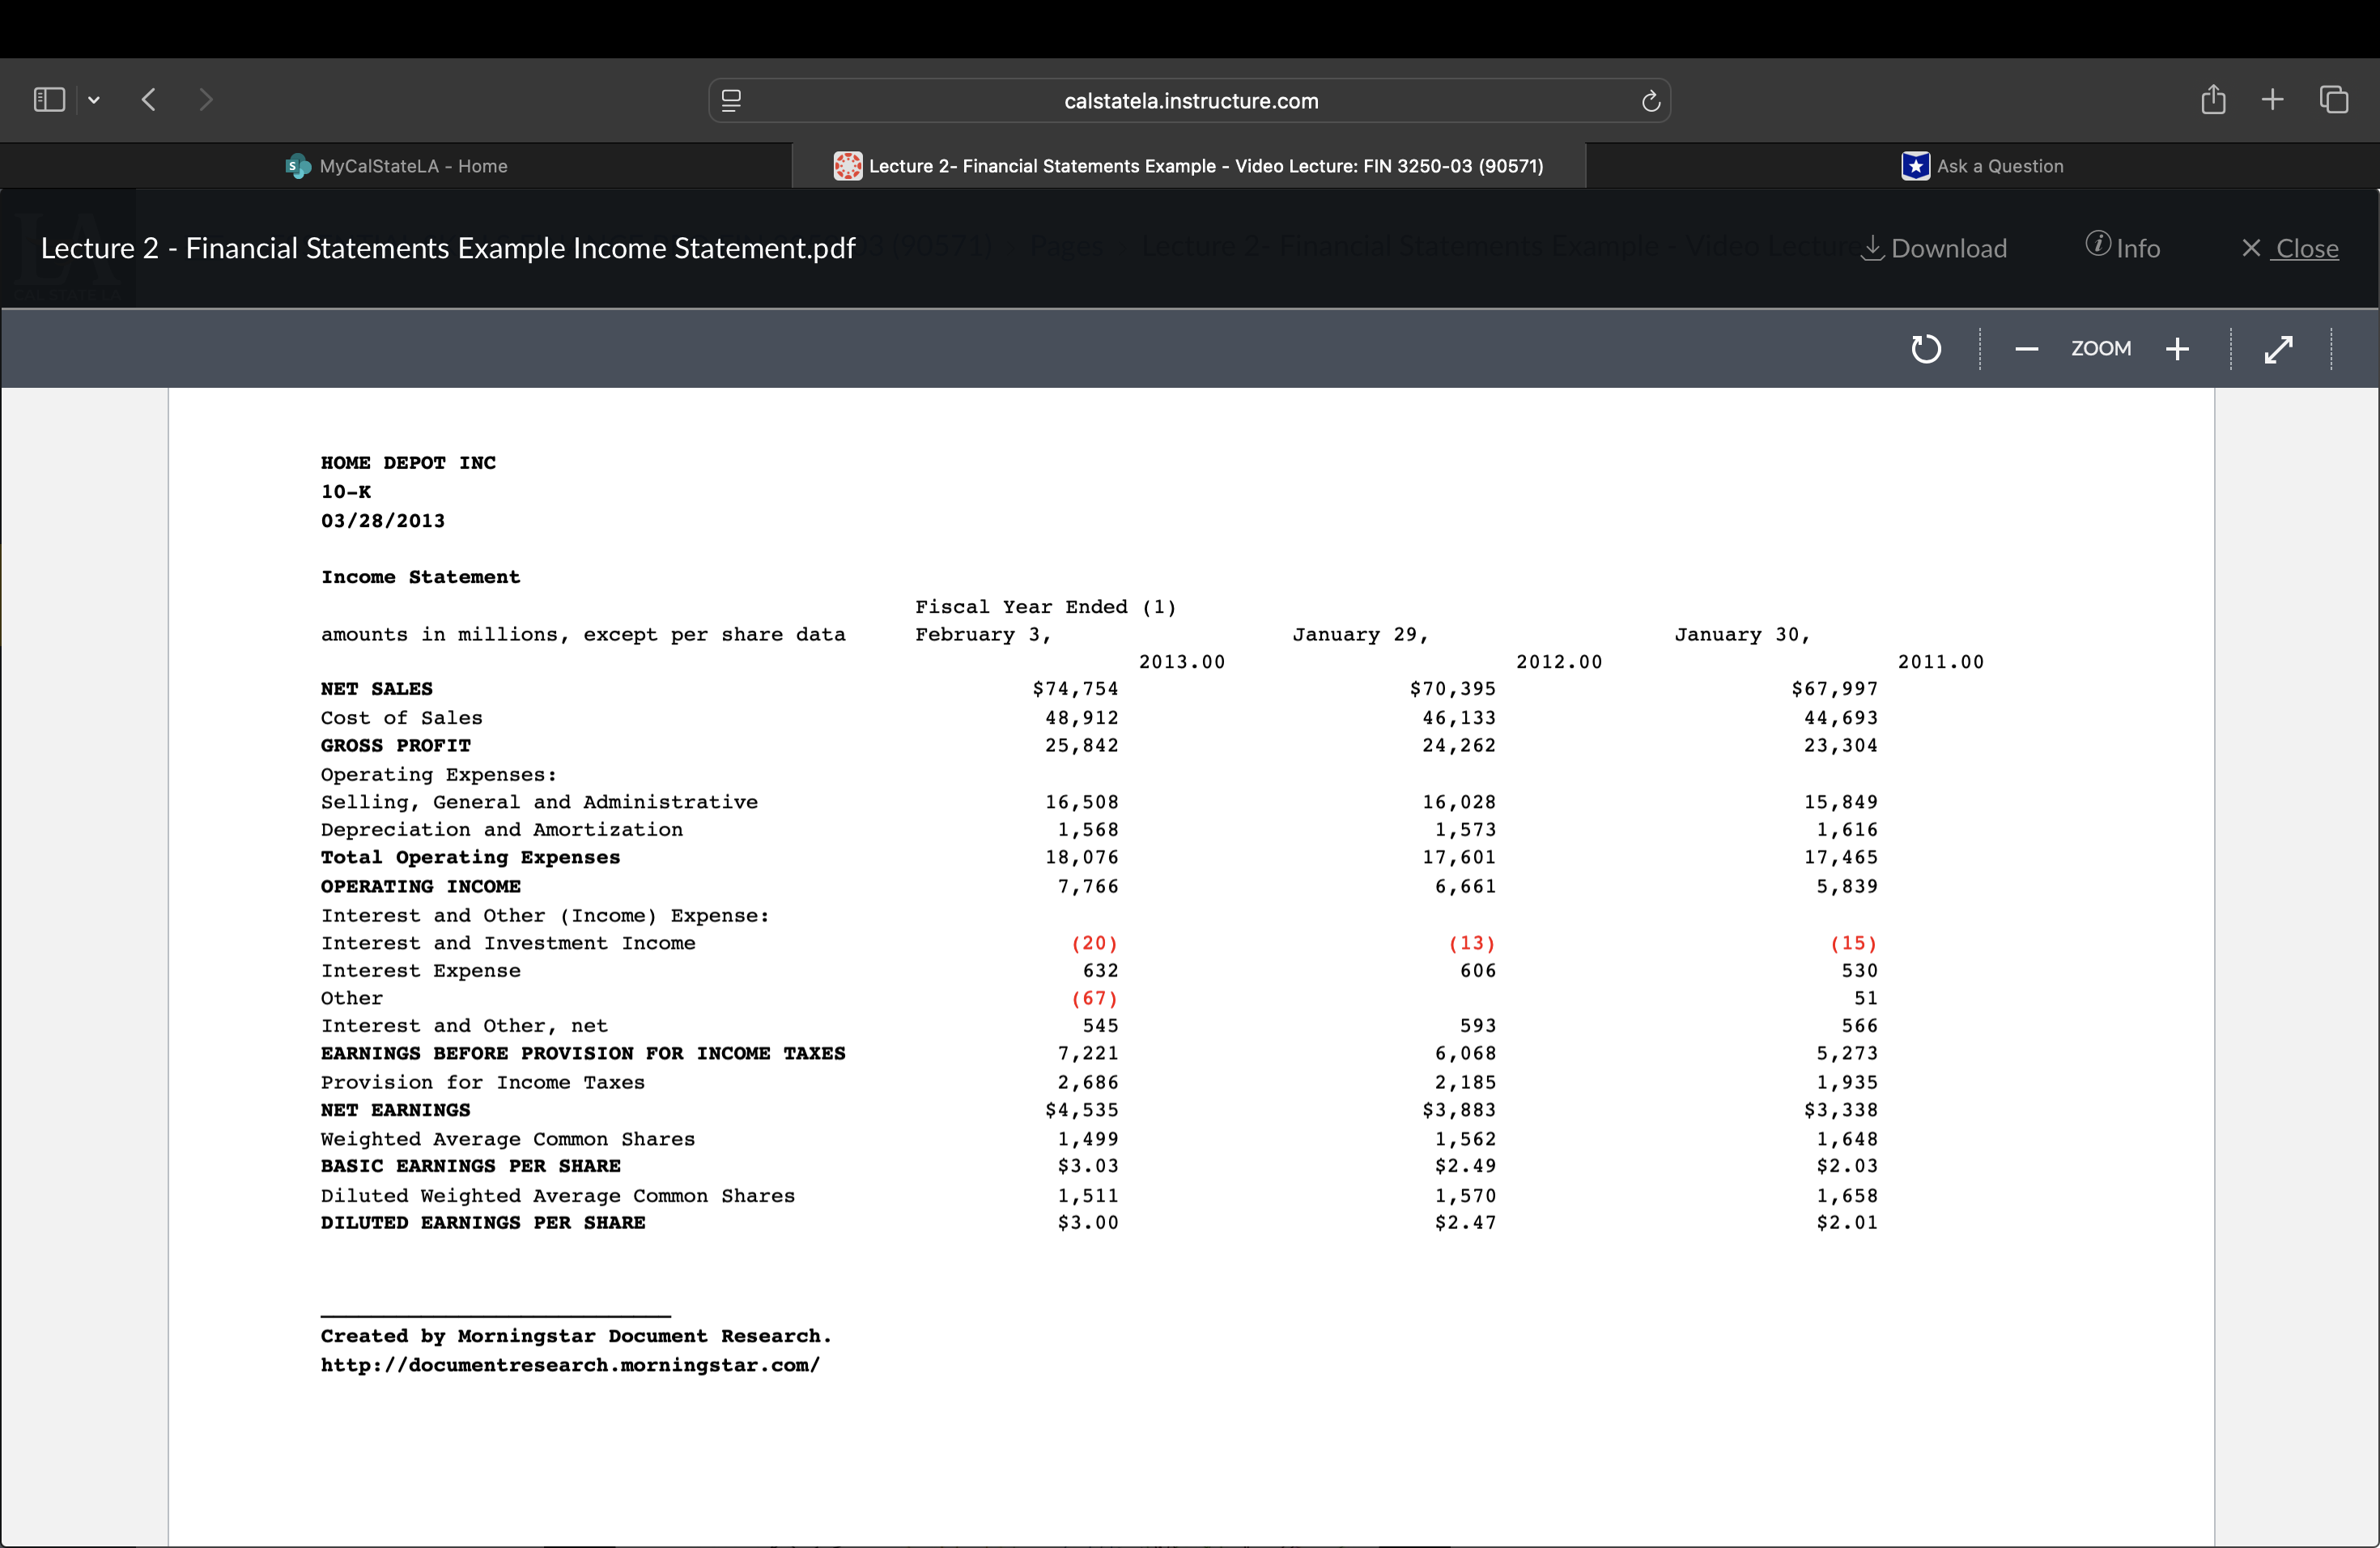
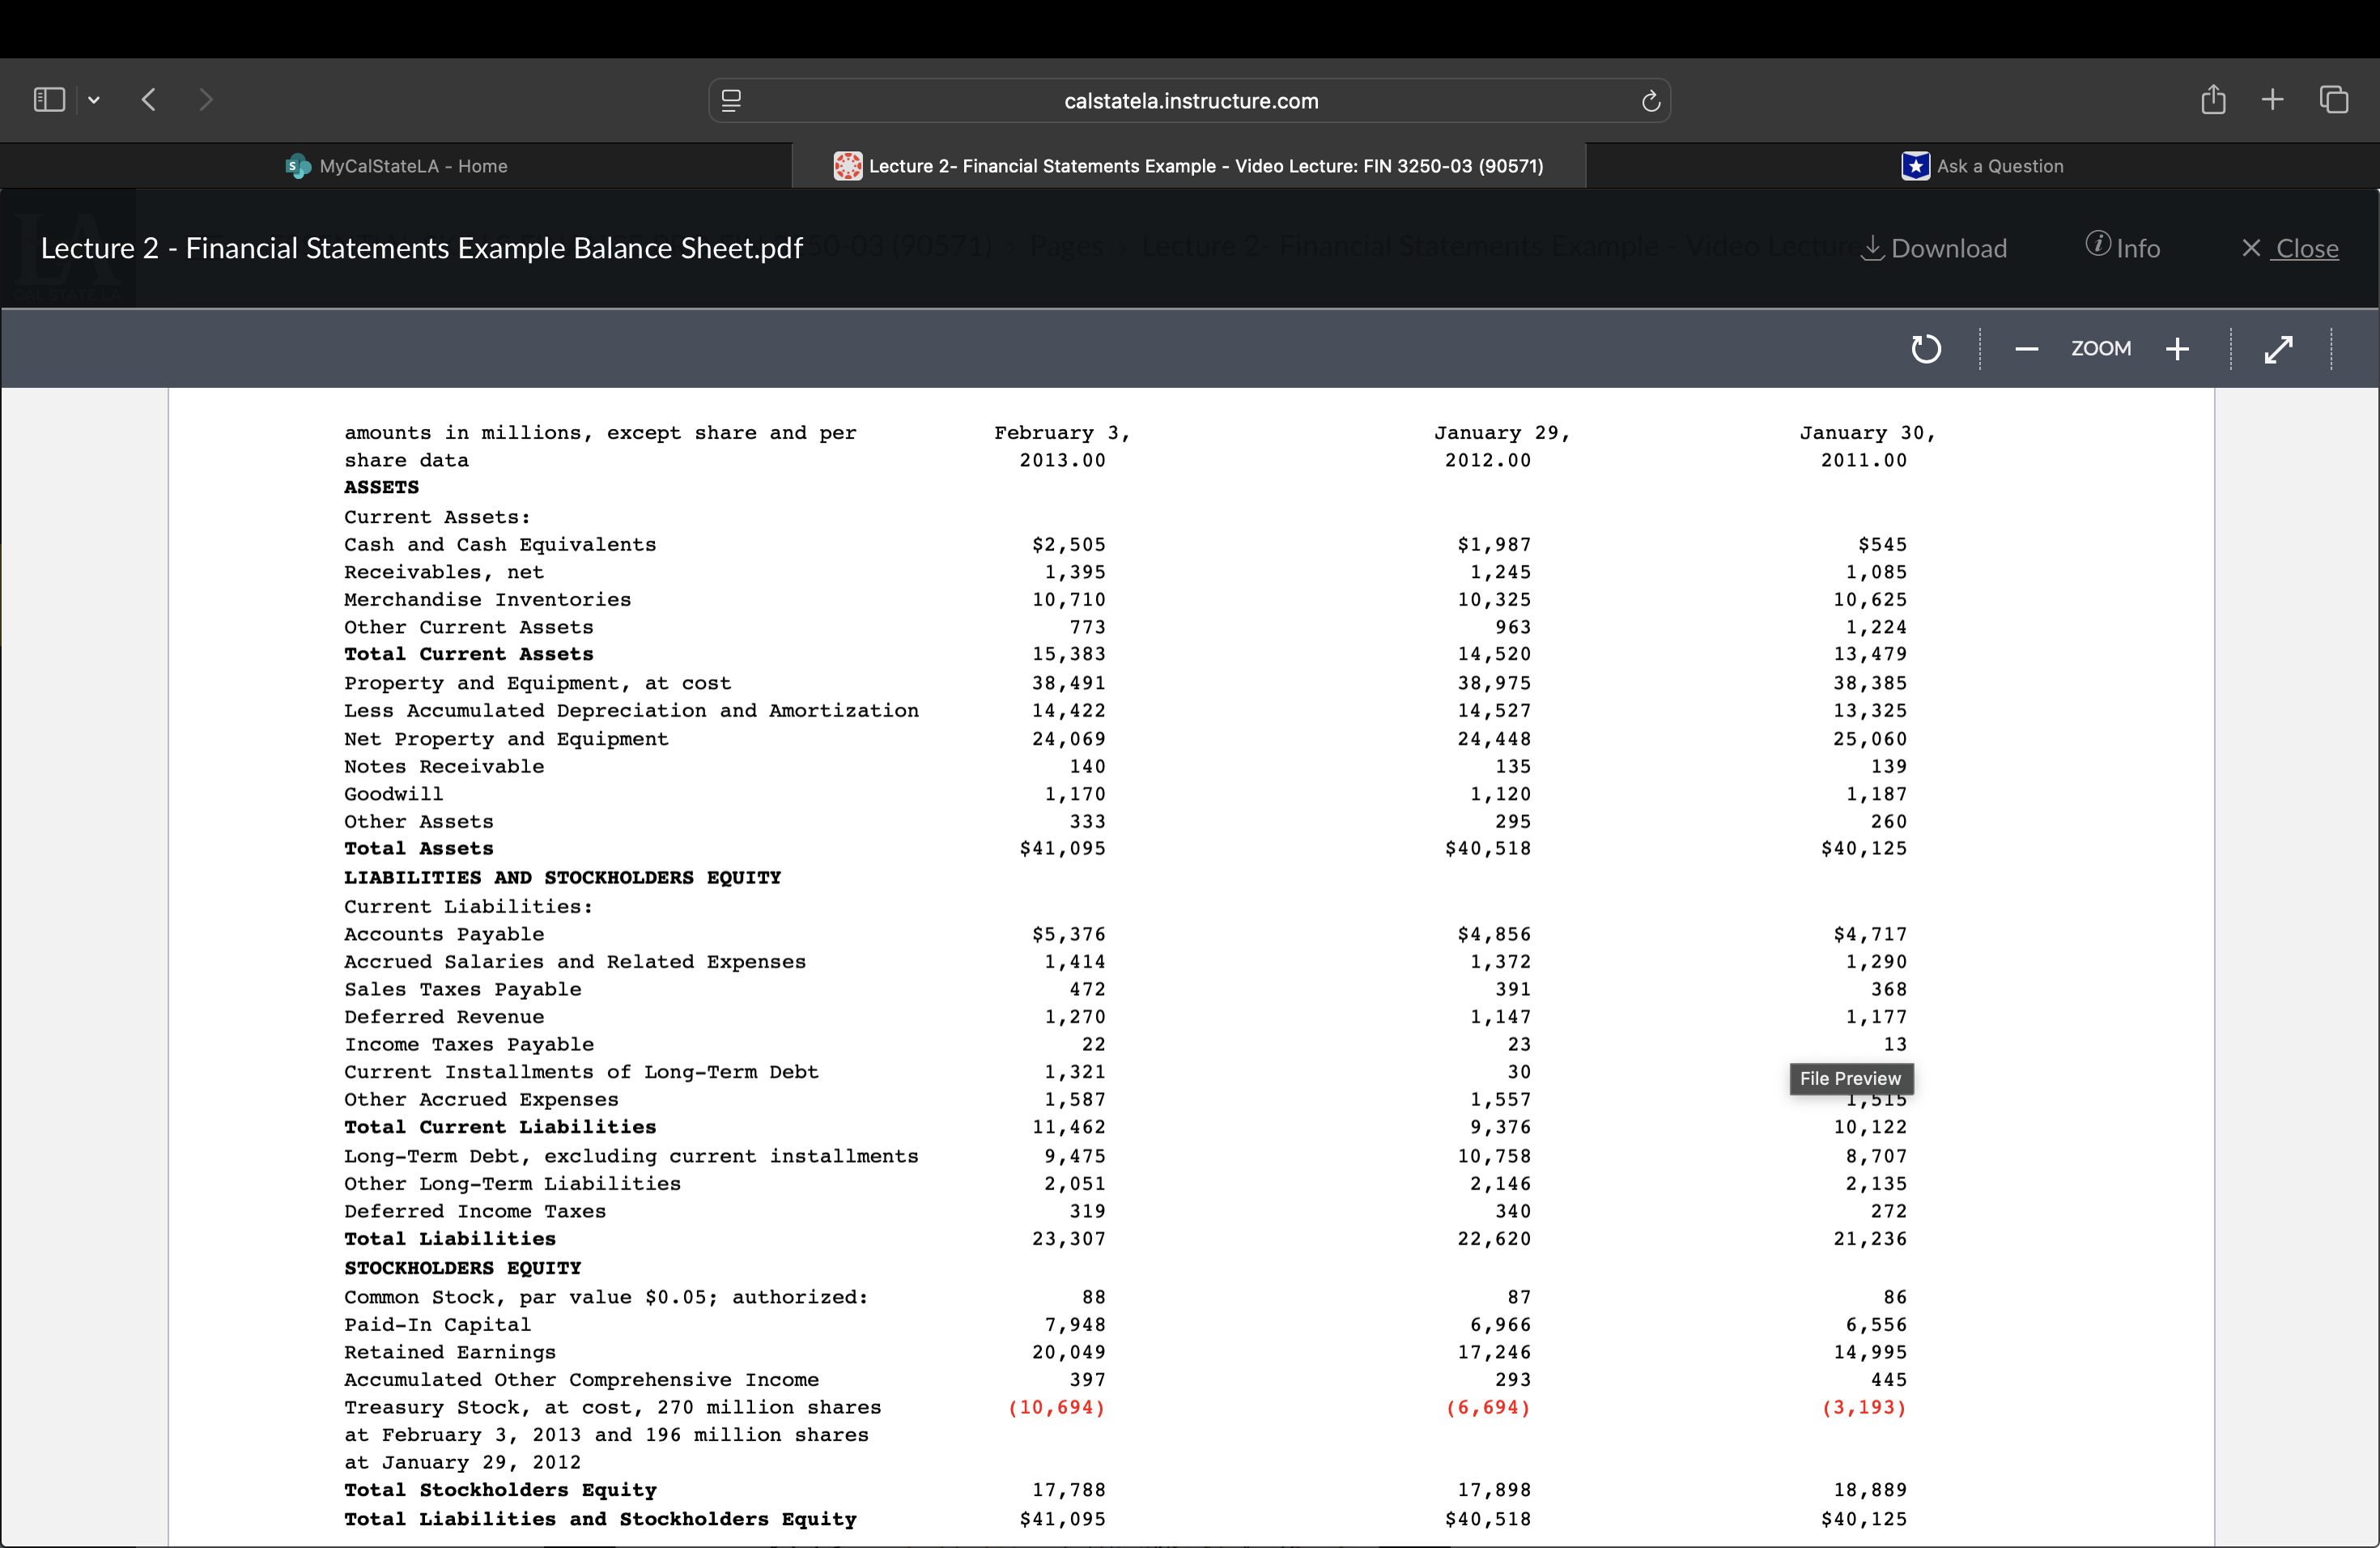
fill in the missing column based on the last two pictures
AutoSave A AF ? C ... Lecture 2 - Financial Statements Example Lecture (With Hints) ~ Q Search (Cmd + Ctrl + U) Home Insert Draw Page Layout Formulas Data Review View Automate Comments Share Calibri (Body) 11 A ab, v Accounting Insert v x Delete v Paste BIUV MVA FE $ % 00 Conditional Format Cell Sort & Find & Sensitivity Add-ins Analyze Formatting as Table Styles Format v Filter Select Data E8 X v fx o 1 2 A B D G H M N O P Q W Z AA AB AC AD AE (FYE February 3, $ in millions) 2011 2012 2013 O U A W Assets Current Assets Cash $ 545 $ 292 Short-term Investments Net Receivables 1,085 1,245 1,395 Inventory 10,625 10,325 10,710 Other Current Assets 1,224 963 773 Total Current Assets 13,479 12,533 13,170 ong Term Assets Property Plant & Equipment (PPE), gross 38,385 38,975 38,491 Accumulated Depreciation of PPE (13,325) (14,527) (14,422) PPE, net 25,060 24,448 24,069 Long Term Investments Note Receivables 139 135 140 Goodwill 1,187 1.120 170 Other Assets 260 295 333 Total Long Term Assets 25,998 25,712 Total Assets $38,531 $38,882 Liabilities Current Liabilities Current Portion of Long-Term Debt $ 1,042 $ 30 $ 1,321 Accounts Payable 4,717 4,856 5,376 Accrued Salaries and Benefits 1,290 1,372 1,414 Sales Tax Payable 368 391 472 Deferred Revenue 177 1,147 1,270 Income Tax Payable 13 23 22 Other Current Accrued Expenses and Other Liabilities 1,515 1,557 1,587 Total Current Liabilities 10.172 9.376 11,462 Long Term Liabilities Long Term Debt 8,707 10,758 3.475 Deferred Income Taxes 272 340 319 Other Deferred Revenue and Long-Term Liabilities 2,135 2,146 2,051 Total Long Term Liabilities 11,114 13,244 11,845 otal Liabilities 21,236 2,620 3,307 Equity Common Stock 86 8/ 88 Paid-In Capital 5,556 6,966 7,948 Capital Stock in excess of par Current Period Net Income $ 3,338 $ 3,883 $ 4,535 Plus: Dividends Paid to Stockholders 13,226 14,995 17,246 Less: (1,569) (1,632) (1,732) Current Period Retained Earnings 14,995 17,246 20,049 Treasury Stock (3,193) (6,694) (10,694) Other 445 293 397 tal Equity 17,898 17,788 Total Liabilities and Equity $40,125 $40,518 $41,095 chec (1,987) (2,213) Objectives Input P&L BS Cash Flow + Ready Accessibility: Good to go m 82%AutoSave A AF ? C ... Lecture 2 - Financial Statements Example Lecture (With Hints) Q Search (Cmd + Ctrl + U) Home Insert Draw Page Layout Formulas Data Review View Automate Comments Share Calibri (Body) 11 ab, v General Insert v x Delete v Paste BIUV MVA FE $ % 9 00 Conditional Format Cell Sort & Find & Sensitivity Add-ins Analyze Formatting as Table Styles Format v Filter Select Data K20 x v fxv 1 2 A B C D E F G H K L M N O P Q R S U V W X The Home Depot, Inc. and Subsidiaries Income Statement for the Years 2011 through 2013 (FYE February 3, $ in millions) 2011 2012 2013 Net Revenue $ 67,997 $ 70,395 $ 74,754 Cost of Revenue 44,693 46,133 48,912 Gross Profit 24,262 25,842 Operating Expense Selling, General and Administrative 15,849 16,028 16,508 Depreciation and Amortization 1,616 1,573 1,568 Total Operating Expense 17,465 17,601 18,076 Earnings Before Interest & Taxes (EBIT) 5 ,839 6,661 7,766 Other Operating Expense (Income) Interest and Investment (Income) (15 (13) (20) Interest Expense 530 606 632 Other 51 (67) Total Other Operating Expense (Income) 566 593 545 Earnings Before Taxes (EBT) 5,273 6,068 7.221 Income Tax 1,935 2,185 2,686 Net Income $ 3,338 $ 3,883 $ 4,535 EBITDA $ 7,455 $ 8,234 $ 9,334 Objectives Input P&L BS Cash Flow + Ready Accessibility: Good to go 100%calstatela.instructure.com Lecture 2- Financial Statements Example - Video Lecture: FIN 3250-03 (90571) Lecture 2 - Financial Statements Example Income Statement.pdf HOME DEPOT INC 10-K 03/28/2013 Income Statement Fiscal Year Ended (1) amounts in millions, except per share data February 3, January 29, January 30, 2013.00 2012.00 2011.00 NET SALES $74,754 $70,395 $67,997 Cost of Sales 48,912 46,133 44,693 GROSS PROFIT 25,842 24,262 23,304 Operating Expenses: Selling, General and Administrative 16,508 16,028 15,849 Depreciation and Amortization 1,568 1,573 1,616 Total Operating Expenses 18,076 17,601 17,465 OPERATING INCOME 7,766 6,661 5,839 Interest and Other (Income) Expense: Interest and Investment Income (20) (13) (15) Interest Expense 632 606 530 Other (67) 51 Interest and Other, net 545 593 566 EARNINGS BEFORE PROVISION FOR INCOME TAXES 7,221 6,068 5,273 Provision for Income Taxes 2,686 2,185 1,935 NET EARNINGS $4,535 $3,883 $3,338 Weighted Average Common Shares 1,499 1,562 1,648 BASIC EARNINGS PER SHARE $3.03 $2.49 $2.03 Diluted Weighted Average Common Shares 1,511 1,570 1,658 DILUTED EARNINGS PER SHARE $3.00 $2.47 $2.01 Created by Morningstar Document Research. http: //documentresearch.morningstar.com/ calstatela.instructure.com Lecture 2- Financial Statements Example - Video Lecture: FIN 3250-03 (90571) Lecture 2 - Financial Statements Example Balance Sheet.pdf amounts in millions, except share and per February 3, January 29, January 30, share data 2013.00 2012.00 2011.00 ASSETS Current Assets: Cash and Cash Equivalents $2,505 $1,987 $545 Receivables, net 1,395 1,245 1,085 Merchandise Inventories 10,710 10,325 10,625 Other Current Assets 33 963 1,224 Total Current Assets 15,383 14,520 13,479 Property and Equipment, at cost 38,491 38,975 38,385 Less Accumulated Depreciation and Amortization 14,422 14,527 13,325 Net Property and Equipment 24,069 24,448 25,060 Notes Receivable 140 135 139 Goodwill 1,170 1,120 1,187 Other Assets 333 295 260 Total Assets $41,095 $40,518 $40,125 LIABILITIES AND STOCKHOLDERS EQUITY Current Liabilities: Accounts Payable $5,376 $4,856 $4,717 Accrued Salaries and Related Expenses 1,414 1,372 1,290 Sales Taxes Payable 472 391 368 Deferred Revenue 1,270 1,147 1,177 Income Taxes Payable 22 23 13 Current Installments of Long-Term Debt 1,321 30 Other Accrued Expenses 1,587 1,557 7 Total Current Liabilities 11,462 9,376 10,122 Long-Term Debt, excluding current installments 9,475 10,758 8,707 Other Long-Term Liabilities 2,051 2,146 2,135 Deferred Income Taxes 319 340 272 Total Liabilities 23,307 22,620 21,236 STOCKHOLDERS EQUITY Common Stock, par value $0.05; authorized: 88 87 86 Paid-In Capital 7,948 6,966 6,556 Retained Earnings 20,049 17,246 14,995 Accumulated Other Comprehensive Income 397 293 445 Treasury Stock, at cost, 270 million shares (10,694) (6,694) (3,193) at February 3, 2013 and 196 million shares at January 29, 2012 Total Stockholders Equity 17,788 17,898 18,889 Total Liabilities and Stockholders Equity $41,095 $40,518 $40,125
Step by Step Solution
There are 3 Steps involved in it
1 Expert Approved Answer
Step: 1 Unlock
Question Has Been Solved by an Expert!
Get step-by-step solutions from verified subject matter experts
Step: 2 Unlock
Step: 3 Unlock
Students Have Also Explored These Related Accounting Questions!