

Question: Fill in the missing t-statistics and p-value in Table 1 and interpret the test results. Table 1 Reports OLS estimates of Eq 1 Dependent Variable:
Fill in the missing t-statistics and p-value in Table 1 and interpret the test results.
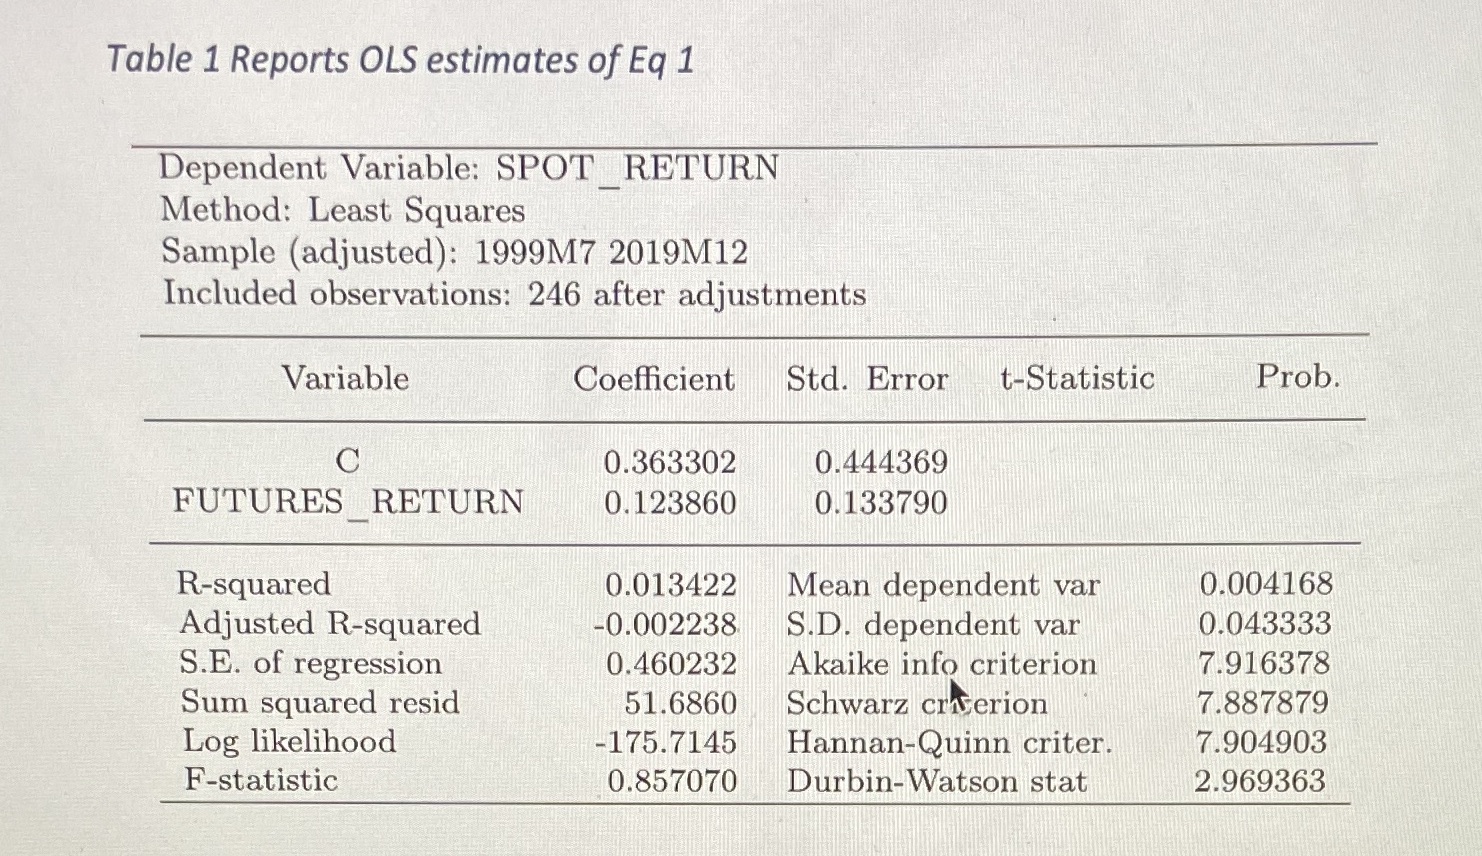
Table 1 Reports OLS estimates of Eq 1 Dependent Variable: SPOT RETURN Method: Least Squares Sample (adjusted): 1999M7 2019M12 Included observations: 246 after adjustments Variable Coefficient Std. Error t-Statistic Prob. C 0.363302 0.444369 FUTURES RETURN 0.123860 0.133790 R-squared 0.013422 Mean dependent var 0.004168 Adjusted R-squared -0.002238 S.D. dependent var 0.043333 S.E. of regression 0.460232 Akaike info criterion 7.916378 Sum squared resid 51.6860 Schwarz criterion 7.887879 Log likelihood -175.7145 Hannan-Quinn criter. 7.904903 F-statistic 0.857070 Durbin-Watson stat 2.969363
Step by Step Solution
There are 3 Steps involved in it

Get step-by-step solutions from verified subject matter experts