

Question: fill in the table in the image regarding Peak Values for NMR and IR with the graphs attached. NMR Spectra Data: Peak Value(s) (ppm) Rationale
fill in the table in the image regarding Peak Values for NMR and IR with the graphs attached. 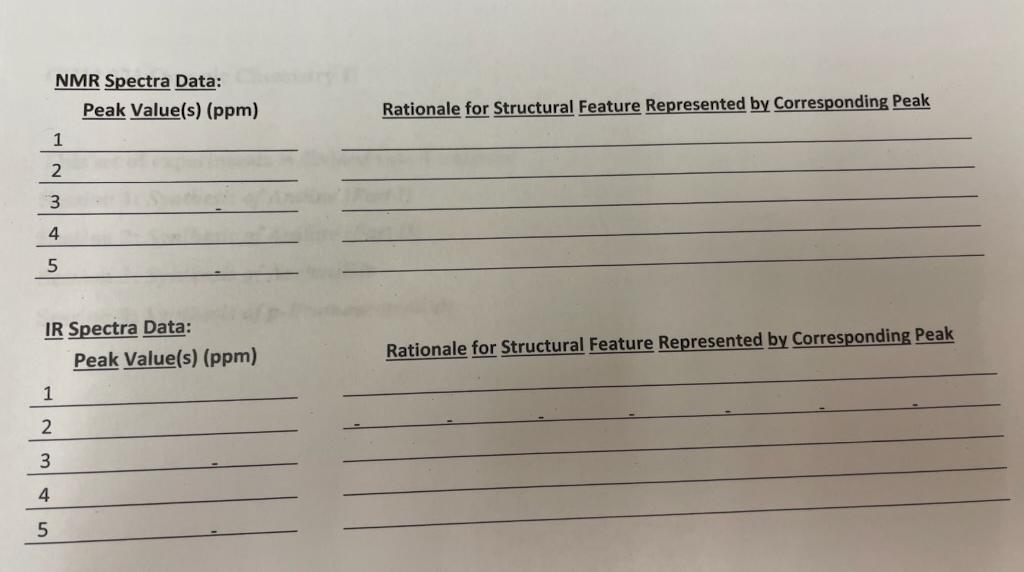
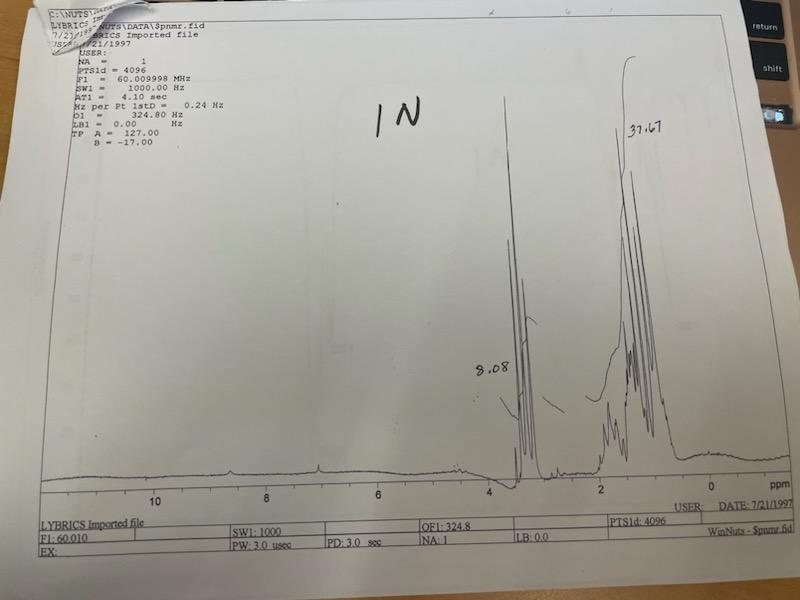
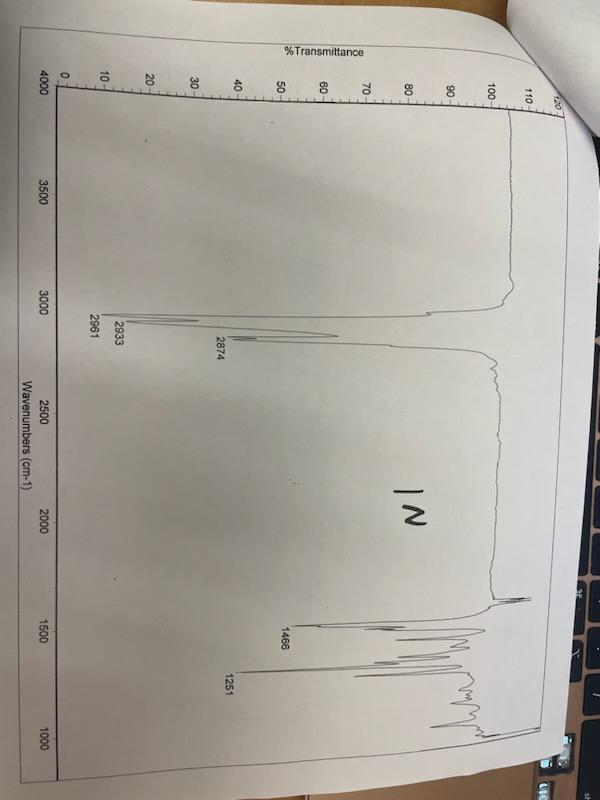
NMR Spectra Data: Peak Value(s) (ppm) Rationale for Structural Feature Represented by Corresponding Peak \begin{tabular}{l} 1 \\ 2 \\ 3 \\ \hline 4 \\ 5 \end{tabular} IR Spectra Data: Peak Value(s) (ppm) Rationale for Structural Feature Represented by Corresponding Peak FP.AB=0.00=127.00=17.00 37.67
Step by Step Solution
There are 3 Steps involved in it
1 Expert Approved Answer
Step: 1 Unlock

Question Has Been Solved by an Expert!
Get step-by-step solutions from verified subject matter experts
Step: 2 Unlock
Step: 3 Unlock