

Question: Fill out the chart below using the data provided. B C D E F Format billion 1 Excel Case #2 - Texas Instruments, Inc. 2
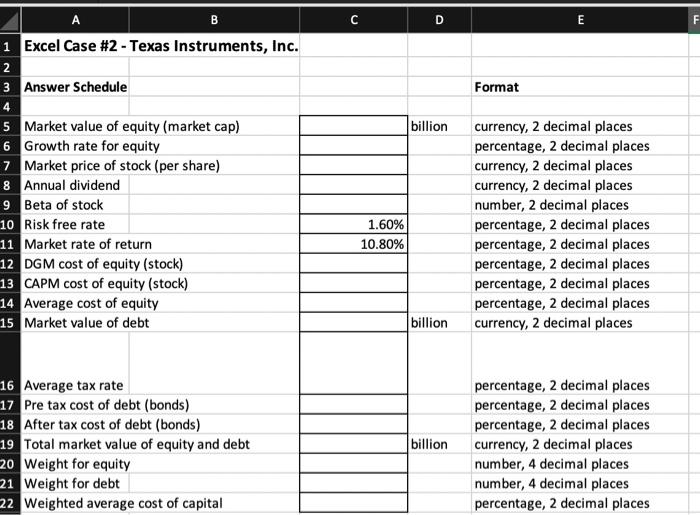
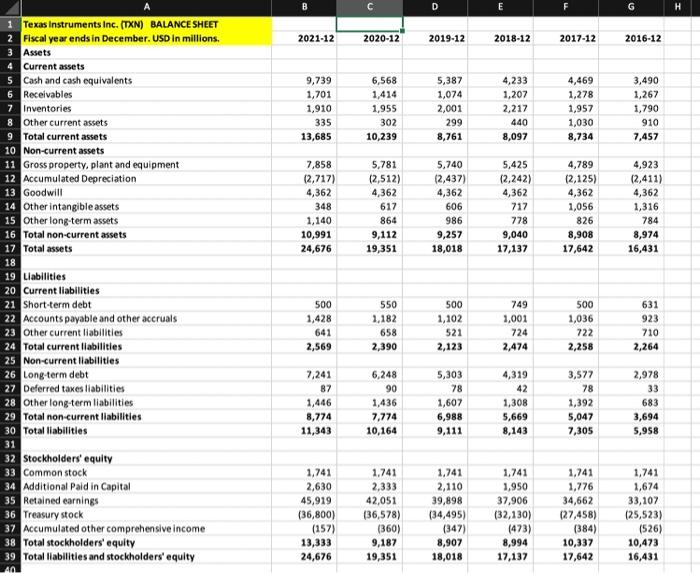
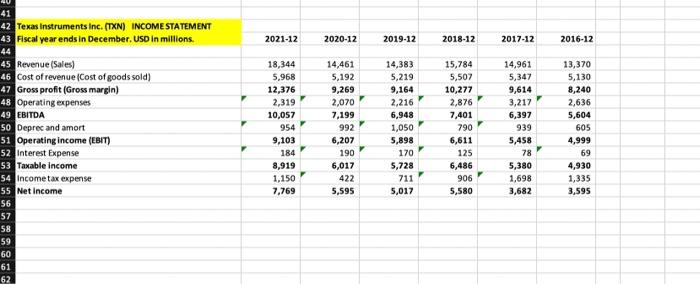
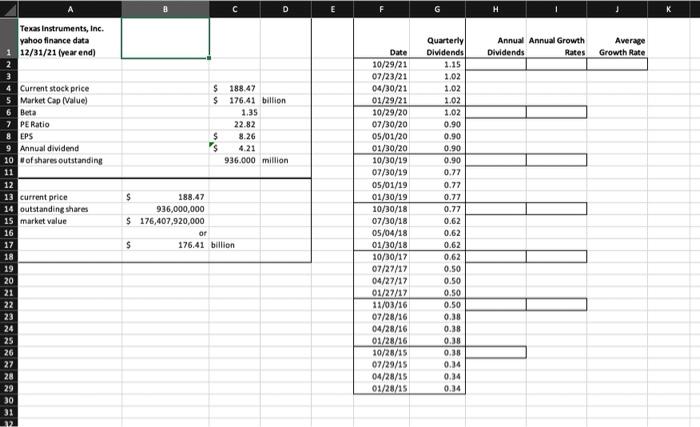
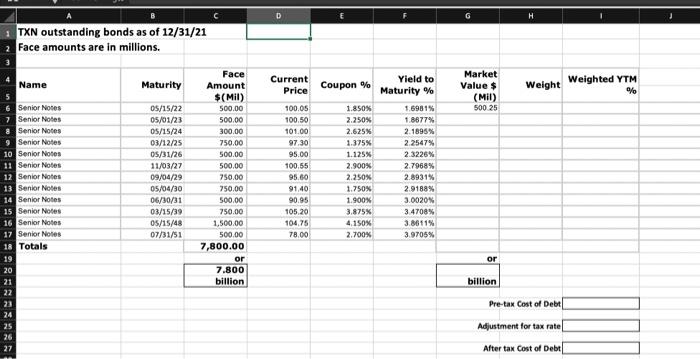
B C D E F Format billion 1 Excel Case #2 - Texas Instruments, Inc. 2 3 Answer Schedule 4 5 Market value of equity (market cap) 6 Growth rate for equity 7 Market price of stock (per share) 8 Annual dividend 9 Beta of stock 10 Risk free rate 11 Market rate of return 12 DGM cost of equity (stock) 13 CAPM cost of equity (stock) 14 Average cost of equity 15 Market value of debt 1.60% 10.80% currency, 2 decimal places percentage, 2 decimal places currency, 2 decimal places currency, 2 decimal places number, 2 decimal places percentage, 2 decimal places percentage, 2 decimal places percentage, 2 decimal places percentage, 2 decimal places percentage, 2 decimal places currency, 2 decimal places billion 16 Average tax rate 17 Pre tax cost of debt (bonds) 18 After tax cost of debt (bonds) 19 Total market value of equity and debt 20 Weight for equity 21 Weight for debt 22 Weighted average cost of capital billion percentage, 2 decimal places percentage, 2 decimal places percentage, 2 decimal places currency, 2 decimal places number, 4 decimal places number, 4 decimal places percentage, 2 decimal places B D G 2021-12 2020-12 2019-12 2018-12 2017-12 2016-12 9,739 1,701 1,910 335 13,685 6,568 1,414 1,955 302 10,239 5,387 1,074 2,001 299 8,761 4,233 1,207 2,217 440 8,097 4,469 1,278 1,957 1,030 8,734 3,490 1,267 1,790 910 7,457 7,858 (2,717) 4,362 348 1,140 10,991 24,676 5,781 (2,512) 4,362 617 864 9,112 19,351 5,740 (2,437) 4,362 606 986 9,257 18,018 5,425 (2,242) 4,362 717 778 9,040 17,137 4,789 (2,125) 4,362 1,056 826 8,908 17,642 4,923 (2,411) 4,362 1,316 784 8,974 16,431 1 Texas Instruments Inc. (TXN) BALANCE SHEET 2 Fiscal year ends in December. USD in millions. 3 Assets 4 Current assets 5 Cash and cash equivalents 6 Receivables 7 Inventories 8 Other current assets 9 Total current assets 10 Non-current assets 11 Gross property, plant and equipment 12 Accumulated Depreciation 13 Goodwill 14 Other intangible assets 15 Other long-term assets 16 Total non-current assets 17 Total assets 18 19 Llabilities 20 Current liabilities 21 Short-term debt 22 Accounts payable and other accruals 23 Other current liabilities 24 Total current liabilities 25 Non-current liabilities 26 Long-term debt 27 Deferred taxes liabilities 28 Other long-term liabilities 29 Total non-current liabilities 30 Total liabilities 31 32 Stockholders' equity 33 Common stock 34 Additional Paid in Capital 35 Retained earnings 36 Treasury stock 37 Accumulated other comprehensive income 38 Total stockholders' equity 39 Total liabilities and stockholders' equity 500 1,428 641 2,569 550 1,182 658 2,390 500 1,102 521 2,123 749 1,001 724 2,474 500 1,036 722 2,258 631 923 710 2,264 7,241 87 1,446 8,774 11,343 6,248 90 1,436 7,774 10,164 5,303 78 1,607 6,988 9,111 4,319 42 1,308 5,669 8,143 3,577 78 1,392 5,047 7,305 2,978 33 683 3,694 5,958 1,741 2,630 45,919 (36,800) (157) 13,333 24,676 1,741 2,333 42,051 (36,578) (360) 9,187 19,351 1,741 2,110 39,898 (34,495) (347) 8,907 18,018 1,741 1,950 37,906 (32,130) (473) 8,994 17,137 1,741 1,776 34,662 (27,458) (384) 10,337 17,642 1,741 1,674 33,107 (25,523) (526) 10,473 16,431 40 2021-12 2020-12 2019-12 2018-12 2017-12 2016-12 41 42 Texas Instruments Inc. (TXN) INCOME STATEMENT 43 Fiscal year ends in December. USD in millions. 44 45 Revenue (Sales) 46 Cost of revenue Cost of goods sold) 47 Gross profit (Gross margin) 48 Operating expenses 49 EBITDA 50 Deprecand amort 51 Operating income (EBIT) 52 Interest Expense 53 Taxable income 54 Income tax expense 55 Net Income 56 57 58 59 60 61 62 18,344 5,968 12,376 2,319 10,057 954 9,103 184 8,919 1,150 7,769 14,461 5,192 9,269 2,070 7,199 992 6,207 190 6,017 422 5,595 14,383 5,219 9,164 2,216 6,948 1,050 5,898 170 5,728 711 5,017 15,784 5,507 10,277 2,876 7,401 790 6,611 14,961 5,347 9,614 3,217 6,397 939 5,458 78 5,380 1,698 3,682 13,370 5,130 8,240 2,636 5,604 605 4,999 69 4,930 1,335 3,595 125 6,486 906 5,580 D E Texas Instruments, Inc. yahoo finance data 12/31/21 (year end) Annual Annual Growth Dividends Rates Average Growth Rate $ 188.47 $ 176.41 billion 4 Current stock price Market Cap (value) 6 Beta 7 PE Ratio 1.35 EPS $ $ 22.82 8.26 4.21 936.000 million $ 188.47 936,000,000 $ 176,407,920,000 or $ 176.41 billion 9 Annual dividend 10 of shares outstanding 11 12 13 current price 14 outstanding shares 15 market value 16 17 18 19 20 21 22 23 24 25 26 27 28 29 30 31 12 Date 10/29/21 07/23/21 04/30/21 01/29/21 10/29/20 07/30/20 05/01/20 01/30/20 10/30/19 07/30/19 05/01/19 01/30/19 10/30/18 07/30/18 05/04/18 01/30/18 10/30/17 07/27/17 04/27/17 01/27/17 11/03/16 07/28/16 04/28/16 01/28/16 10/28/15 07/29/15 04/28/15 01/28/15 Quarterly Dividends 1.15 1.02 1.02 1.02 1.02 0.90 0.90 0.90 0.90 0.77 0.77 0.77 0.77 0.62 0.62 0.62 0.62 0.50 0.50 0.50 0.50 0.38 0.38 0.38 0.38 0.34 0.34 0.34 TXN outstanding bonds as of 12/31/21 Face amounts are in millions. Name Maturity Market Value $ Current Price Coupon % Weight Weighted YTM % (MI) 500 25 Senior Notes Senior Notes Senior Notes 9 Senior Notes 10 Senior Notes 11 Senior Notes 12 Senior Notes 13 Senior Notes 14 Senior Notes 15 Senior Not 16 Senior Notes 17 Senior Notes 18 Totals 19 20 21 22 23 24 25 26 27 05/15/22 05/01/23 05/15/24 03/12/25 05/31/26 11/03/27 09/04/29 05/04/30 06/30/31 03/15/39 05/15/48 07/31/51 Face Amount $(Mil) 500.00 500.00 300.00 750.00 500.00 500.00 750.00 750.00 500.00 750.00 1,500.00 500.00 7,800.00 or 7.800 billion 100.05 100.50 101.00 97.30 95.00 100.55 95.60 91.40 90.95 105,20 104.75 78.00 1.850% 2.250% 2.625% 1.375% 1.125% 2.900% 2.250W 1.750% 1.900% 3.875% 4.150 2.700% Yield to Maturity % 1.6981% 1.8677% 2.1895% 2.2547% 2.3225% 2.7968% 2.8931% 2.9188% 3.0020% 3.4708% 3.8611% 3.9705% or billion Pre-tax Cost of Debt Adjustment for tax rate! After tax Cost of Debt B C D E F Format billion 1 Excel Case #2 - Texas Instruments, Inc. 2 3 Answer Schedule 4 5 Market value of equity (market cap) 6 Growth rate for equity 7 Market price of stock (per share) 8 Annual dividend 9 Beta of stock 10 Risk free rate 11 Market rate of return 12 DGM cost of equity (stock) 13 CAPM cost of equity (stock) 14 Average cost of equity 15 Market value of debt 1.60% 10.80% currency, 2 decimal places percentage, 2 decimal places currency, 2 decimal places currency, 2 decimal places number, 2 decimal places percentage, 2 decimal places percentage, 2 decimal places percentage, 2 decimal places percentage, 2 decimal places percentage, 2 decimal places currency, 2 decimal places billion 16 Average tax rate 17 Pre tax cost of debt (bonds) 18 After tax cost of debt (bonds) 19 Total market value of equity and debt 20 Weight for equity 21 Weight for debt 22 Weighted average cost of capital billion percentage, 2 decimal places percentage, 2 decimal places percentage, 2 decimal places currency, 2 decimal places number, 4 decimal places number, 4 decimal places percentage, 2 decimal places B D G 2021-12 2020-12 2019-12 2018-12 2017-12 2016-12 9,739 1,701 1,910 335 13,685 6,568 1,414 1,955 302 10,239 5,387 1,074 2,001 299 8,761 4,233 1,207 2,217 440 8,097 4,469 1,278 1,957 1,030 8,734 3,490 1,267 1,790 910 7,457 7,858 (2,717) 4,362 348 1,140 10,991 24,676 5,781 (2,512) 4,362 617 864 9,112 19,351 5,740 (2,437) 4,362 606 986 9,257 18,018 5,425 (2,242) 4,362 717 778 9,040 17,137 4,789 (2,125) 4,362 1,056 826 8,908 17,642 4,923 (2,411) 4,362 1,316 784 8,974 16,431 1 Texas Instruments Inc. (TXN) BALANCE SHEET 2 Fiscal year ends in December. USD in millions. 3 Assets 4 Current assets 5 Cash and cash equivalents 6 Receivables 7 Inventories 8 Other current assets 9 Total current assets 10 Non-current assets 11 Gross property, plant and equipment 12 Accumulated Depreciation 13 Goodwill 14 Other intangible assets 15 Other long-term assets 16 Total non-current assets 17 Total assets 18 19 Llabilities 20 Current liabilities 21 Short-term debt 22 Accounts payable and other accruals 23 Other current liabilities 24 Total current liabilities 25 Non-current liabilities 26 Long-term debt 27 Deferred taxes liabilities 28 Other long-term liabilities 29 Total non-current liabilities 30 Total liabilities 31 32 Stockholders' equity 33 Common stock 34 Additional Paid in Capital 35 Retained earnings 36 Treasury stock 37 Accumulated other comprehensive income 38 Total stockholders' equity 39 Total liabilities and stockholders' equity 500 1,428 641 2,569 550 1,182 658 2,390 500 1,102 521 2,123 749 1,001 724 2,474 500 1,036 722 2,258 631 923 710 2,264 7,241 87 1,446 8,774 11,343 6,248 90 1,436 7,774 10,164 5,303 78 1,607 6,988 9,111 4,319 42 1,308 5,669 8,143 3,577 78 1,392 5,047 7,305 2,978 33 683 3,694 5,958 1,741 2,630 45,919 (36,800) (157) 13,333 24,676 1,741 2,333 42,051 (36,578) (360) 9,187 19,351 1,741 2,110 39,898 (34,495) (347) 8,907 18,018 1,741 1,950 37,906 (32,130) (473) 8,994 17,137 1,741 1,776 34,662 (27,458) (384) 10,337 17,642 1,741 1,674 33,107 (25,523) (526) 10,473 16,431 40 2021-12 2020-12 2019-12 2018-12 2017-12 2016-12 41 42 Texas Instruments Inc. (TXN) INCOME STATEMENT 43 Fiscal year ends in December. USD in millions. 44 45 Revenue (Sales) 46 Cost of revenue Cost of goods sold) 47 Gross profit (Gross margin) 48 Operating expenses 49 EBITDA 50 Deprecand amort 51 Operating income (EBIT) 52 Interest Expense 53 Taxable income 54 Income tax expense 55 Net Income 56 57 58 59 60 61 62 18,344 5,968 12,376 2,319 10,057 954 9,103 184 8,919 1,150 7,769 14,461 5,192 9,269 2,070 7,199 992 6,207 190 6,017 422 5,595 14,383 5,219 9,164 2,216 6,948 1,050 5,898 170 5,728 711 5,017 15,784 5,507 10,277 2,876 7,401 790 6,611 14,961 5,347 9,614 3,217 6,397 939 5,458 78 5,380 1,698 3,682 13,370 5,130 8,240 2,636 5,604 605 4,999 69 4,930 1,335 3,595 125 6,486 906 5,580 D E Texas Instruments, Inc. yahoo finance data 12/31/21 (year end) Annual Annual Growth Dividends Rates Average Growth Rate $ 188.47 $ 176.41 billion 4 Current stock price Market Cap (value) 6 Beta 7 PE Ratio 1.35 EPS $ $ 22.82 8.26 4.21 936.000 million $ 188.47 936,000,000 $ 176,407,920,000 or $ 176.41 billion 9 Annual dividend 10 of shares outstanding 11 12 13 current price 14 outstanding shares 15 market value 16 17 18 19 20 21 22 23 24 25 26 27 28 29 30 31 12 Date 10/29/21 07/23/21 04/30/21 01/29/21 10/29/20 07/30/20 05/01/20 01/30/20 10/30/19 07/30/19 05/01/19 01/30/19 10/30/18 07/30/18 05/04/18 01/30/18 10/30/17 07/27/17 04/27/17 01/27/17 11/03/16 07/28/16 04/28/16 01/28/16 10/28/15 07/29/15 04/28/15 01/28/15 Quarterly Dividends 1.15 1.02 1.02 1.02 1.02 0.90 0.90 0.90 0.90 0.77 0.77 0.77 0.77 0.62 0.62 0.62 0.62 0.50 0.50 0.50 0.50 0.38 0.38 0.38 0.38 0.34 0.34 0.34 TXN outstanding bonds as of 12/31/21 Face amounts are in millions. Name Maturity Market Value $ Current Price Coupon % Weight Weighted YTM % (MI) 500 25 Senior Notes Senior Notes Senior Notes 9 Senior Notes 10 Senior Notes 11 Senior Notes 12 Senior Notes 13 Senior Notes 14 Senior Notes 15 Senior Not 16 Senior Notes 17 Senior Notes 18 Totals 19 20 21 22 23 24 25 26 27 05/15/22 05/01/23 05/15/24 03/12/25 05/31/26 11/03/27 09/04/29 05/04/30 06/30/31 03/15/39 05/15/48 07/31/51 Face Amount $(Mil) 500.00 500.00 300.00 750.00 500.00 500.00 750.00 750.00 500.00 750.00 1,500.00 500.00 7,800.00 or 7.800 billion 100.05 100.50 101.00 97.30 95.00 100.55 95.60 91.40 90.95 105,20 104.75 78.00 1.850% 2.250% 2.625% 1.375% 1.125% 2.900% 2.250W 1.750% 1.900% 3.875% 4.150 2.700% Yield to Maturity % 1.6981% 1.8677% 2.1895% 2.2547% 2.3225% 2.7968% 2.8931% 2.9188% 3.0020% 3.4708% 3.8611% 3.9705% or billion Pre-tax Cost of Debt Adjustment for tax rate! After tax Cost of Debt
Step by Step Solution
There are 3 Steps involved in it

Get step-by-step solutions from verified subject matter experts