

Question: Fill out the chart. The information is provided within the screenshots. J.C. Penney Financial Analysis use page 34 to 36 Financial Measure Fiscal Year Fiscal
Fill out the chart. The information is provided within the screenshots.
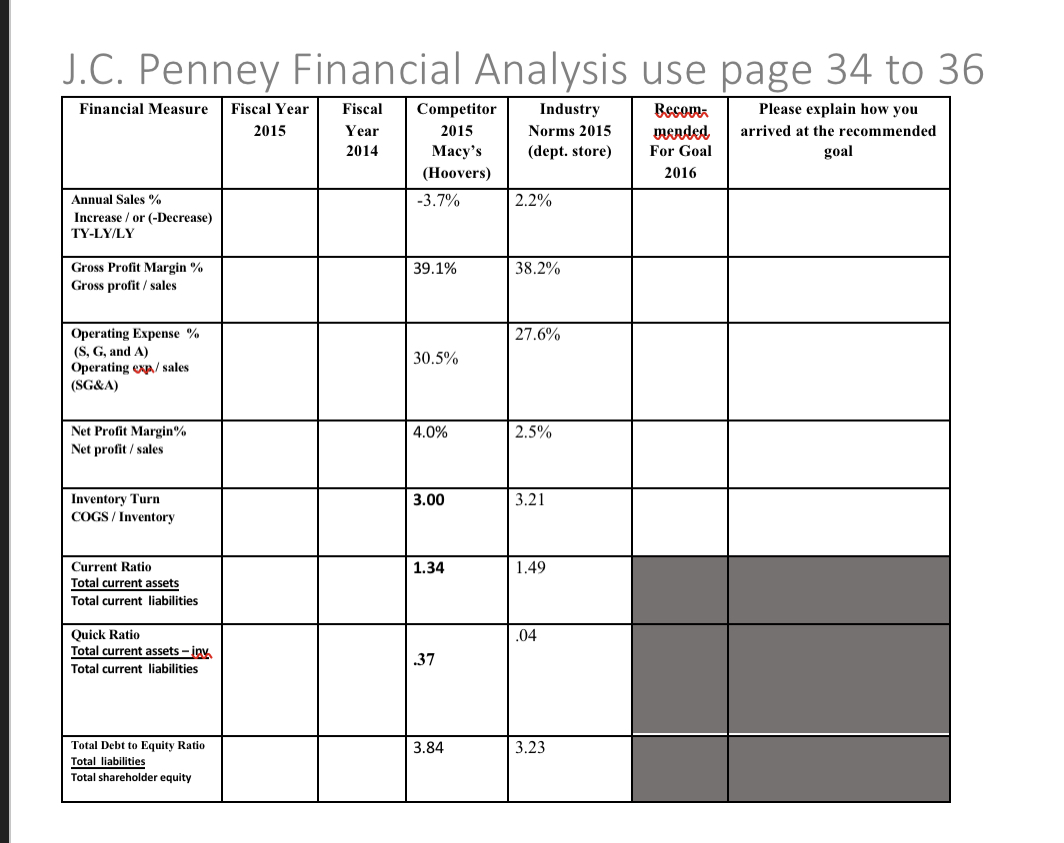
J.C. Penney Financial Analysis use page 34 to 36 Financial Measure Fiscal Year Fiscal Competitor 2015 Year 2014 2015 Macy's (Hoovers) Industry Norms 2015 (dept. store) Annual Sales % -3.7% 2.2% Becom mended For Goal 2016 Please explain how you arrived at the recommended goal Increase or (-Decrease) TY-LY/LY Gross Profit Margin % 39.1% 38.2% Gross profit/ sales Operating Expense % 27.6% (S, G, and A) 30.5% Operating exp/sales (SG&A) Net Profit Margin% 4.0% 2.5% Net profit/sales Inventory Turn 3.00 3.21 COGS/Inventory Current Ratio 1.34 1.49 Total current assets Total current liabilities Quick Ratio .04 Total current assets-inv .37 Total current liabilities 37 Total Debt to Equity Ratio Total liabilities Total shareholder equity 3.84 3.23
Step by Step Solution
There are 3 Steps involved in it

Get step-by-step solutions from verified subject matter experts