

Question: fill out the missing values Table 3: Acceleration of the Cart-Mass System with friction (SIMULATION) Distance, s m Mass of Hanging time, t Acceleration, Percent
fill out the missing values
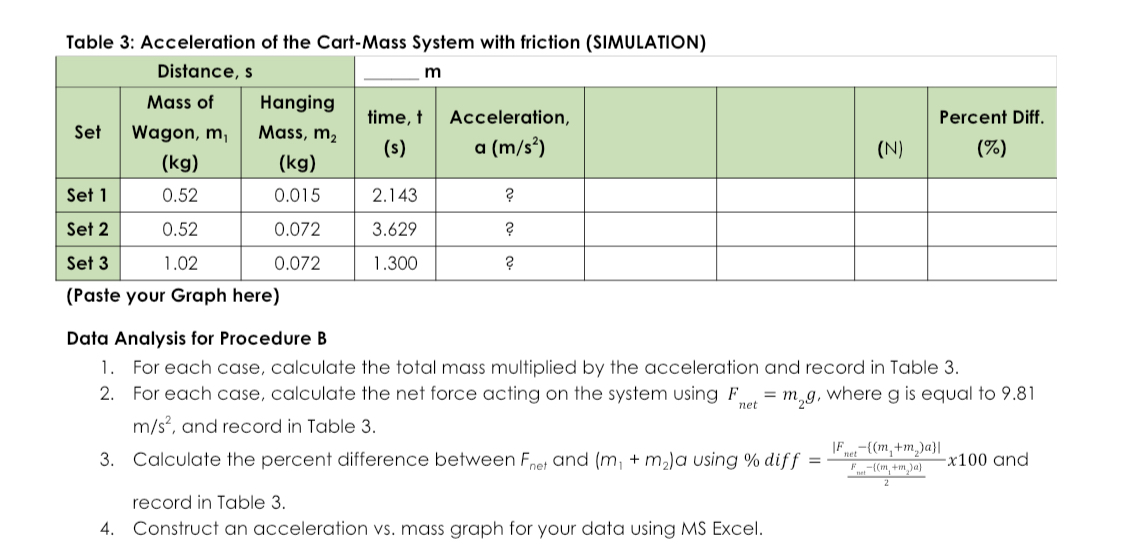
Table 3: Acceleration of the Cart-Mass System with friction (SIMULATION) Distance, s m Mass of Hanging time, t Acceleration, Percent Diff. Set Wagon, m, Mass, m2 (s) a (m/s' ) (N) () (kg) (kg) Set 1 0.52 0.015 2.143 Set 2 0.52 0.072 3.629 Set 3 1.02 0.072 1.300 (Paste your Graph here) Data Analysis for Procedure B 1. For each case, calculate the total mass multiplied by the acceleration and record in Table 3. 2. For each case, calculate the net force acting on the system using F = m,g, where g is equal to 9.81 m/s', and record in Table 3. IF -{(m, +m, )all 3. Calculate the percent difference between F., and (m, + m,)a using % diff = F-((m +m )a) x100 and record in Table 3. 4. Construct an acceleration vs. mass graph for your data using MS Excel
Step by Step Solution
There are 3 Steps involved in it

Get step-by-step solutions from verified subject matter experts