

Question: fill out the tables and answer extra questions if possible as well please! Western Gas & Electric Co. Income Statement January 1 - December 31,
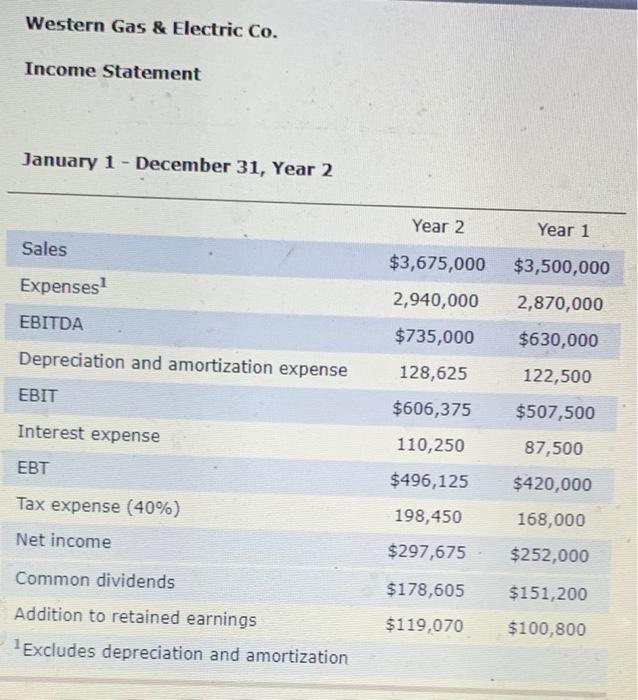
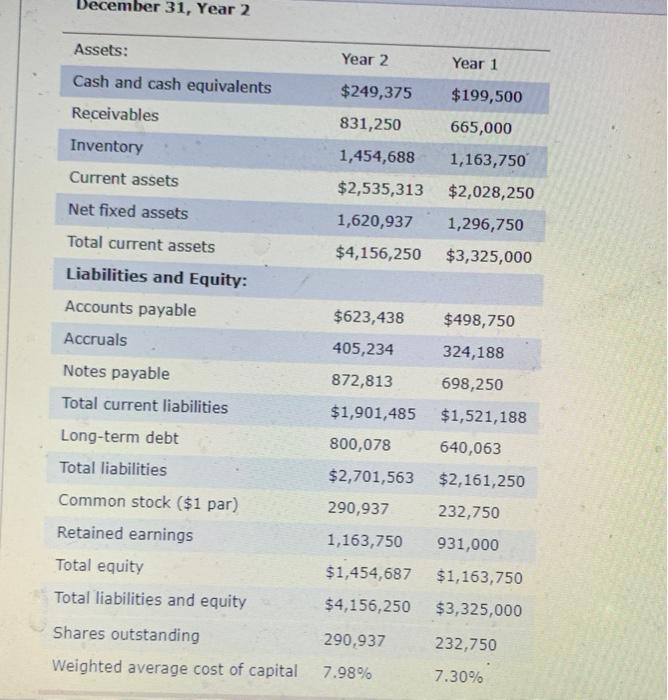
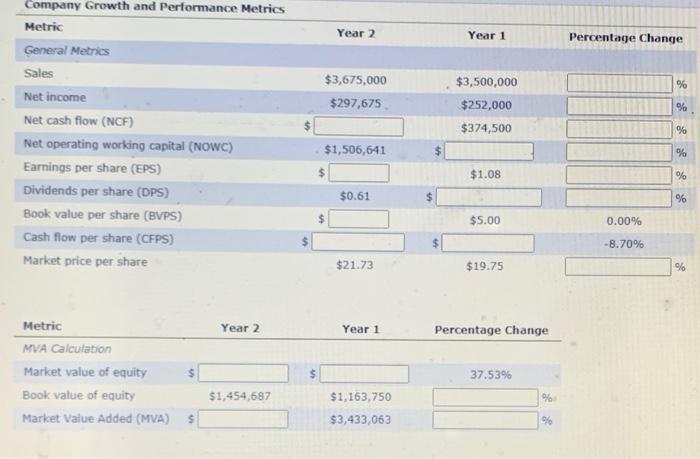
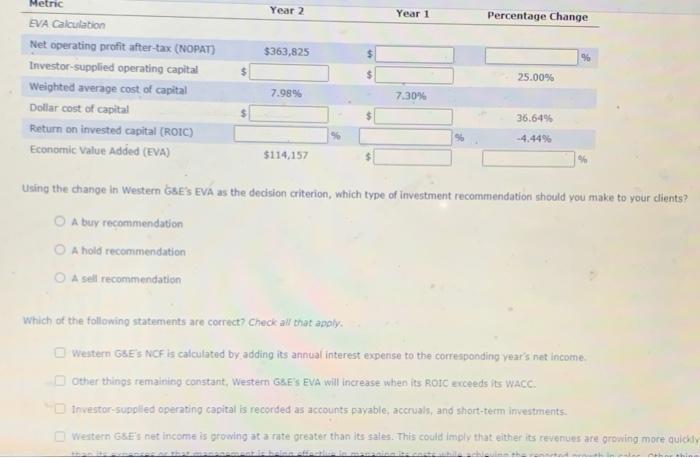
Western Gas & Electric Co. Income Statement January 1 - December 31, Year 2 Year 2 Year 1 Sales $3,675,000 $3,500,000 Expenses 2,940,000 2,870,000 EBITDA $735,000 $630,000 Depreciation and amortization expense 128,625 122,500 EBIT $606,375 $507,500 Interest expense 110,250 87,500 EBT $496,125 $420,000 Tax expense (40%) Net income 198,450 168,000 $297,675 $252,000 $178,605 $151,200 Common dividends Addition to retained earnings Excludes depreciation and amortization $119,070 $100,800 December 31, Year 2 Assets: Year 2 Year 1 Cash and cash equivalents Receivables $249,375 $199,500 831,250 665,000 Inventory Current assets 1,454,688 1,163,750 $2,535,313 Net fixed assets $2,028,250 1,296,750 1,620,937 $4,156,250 $3,325,000 Total current assets Liabilities and Equity: Accounts payable Accruals $623,438 $498,750 405,234 324,188 Notes payable Total current liabilities 872,813 698,250 $1,901,485 $1,521,188 Long-term debt 800,078 640,063 $2,701,563 $2,161,250 290,937 232,750 Total liabilities Common stock ($1 par) Retained earnings Total equity Total liabilities and equity 1,163,750 931,000 $1,454,687 $1,163,750 $4,156,250 $3,325,000 290,937 Shares outstanding Weighted average cost of capital 232,750 7.98% 7.30% Year 2 Year 1 Percentage Change % $3,675,000 $297,675 $3,500,000 $252,000 $374,500 % Company Growth and Performance Metrics Metric General Metrics sales Net income Net cash flow (NCF) Net operating working capital (NOWC) Earnings per share (EPS) Dividends per share (DPS) Book value per share (BVPS) Cash flow per share (CFPS) Market price per share % $1,506,641 $ % $1.08 % $0.61 % $5.00 0.00% -8.70% $21.73 $19.75 9% Year 2 Year 1 Percentage Change Metric MVA Calculation Market value of equity Book value of equity Market Value Added (MVA) $ 37.53% $1,454,687 $1,163,750 % 5 $3,433,063 0% Year 2 Year 1 Percentage Change $363,825 $ 96 $ Metnc EVA Calculation Net operating profit after-tax (NOPAT) Investor-supplied operating capital Weighted average cost of capital Dollar cost of capital Return on invested capital (ROIC) Economic Value Added (EVA) 25.00% 7.989 7.30% 36.649 -4.44% $114,157 Using the change in Western GRE'S EVA as the decision criterion, which type of investment recommendation should you make to your clients? A buy recommendation O A hold recommendation A sell recommendation Which of the following statements are correct? Check all that apply Western GES NCF is calculated by adding its annual interest expense to the corresponding year's net income. Other things remaining constant, Westem GRES EVA will increase when its ROIC exceeds its WACC. Investor-supplied operating capital is recorded as accounts payable, accruals, and short-term investments. Western Ge's net income is growing at a rate greater than its sales. This could imply that either its revenues are growing more quickly
Step by Step Solution
There are 3 Steps involved in it

Get step-by-step solutions from verified subject matter experts